QQQ 97-day bearish forecast — Nov 8, 2026
- Bias: Bearish
- Timeframe: 97 days (made Nov 8, 2026, target date Feb 12, 2027)
- Price at analysis: $656.10
- Price target: $630.00
- Expected range: $565.00 – $710.00
- Result: Pending — graded after the close on Feb 12, 2027
Get a free AI analysis of QQQ today
Analysis
TECHNICAL INDICATORS
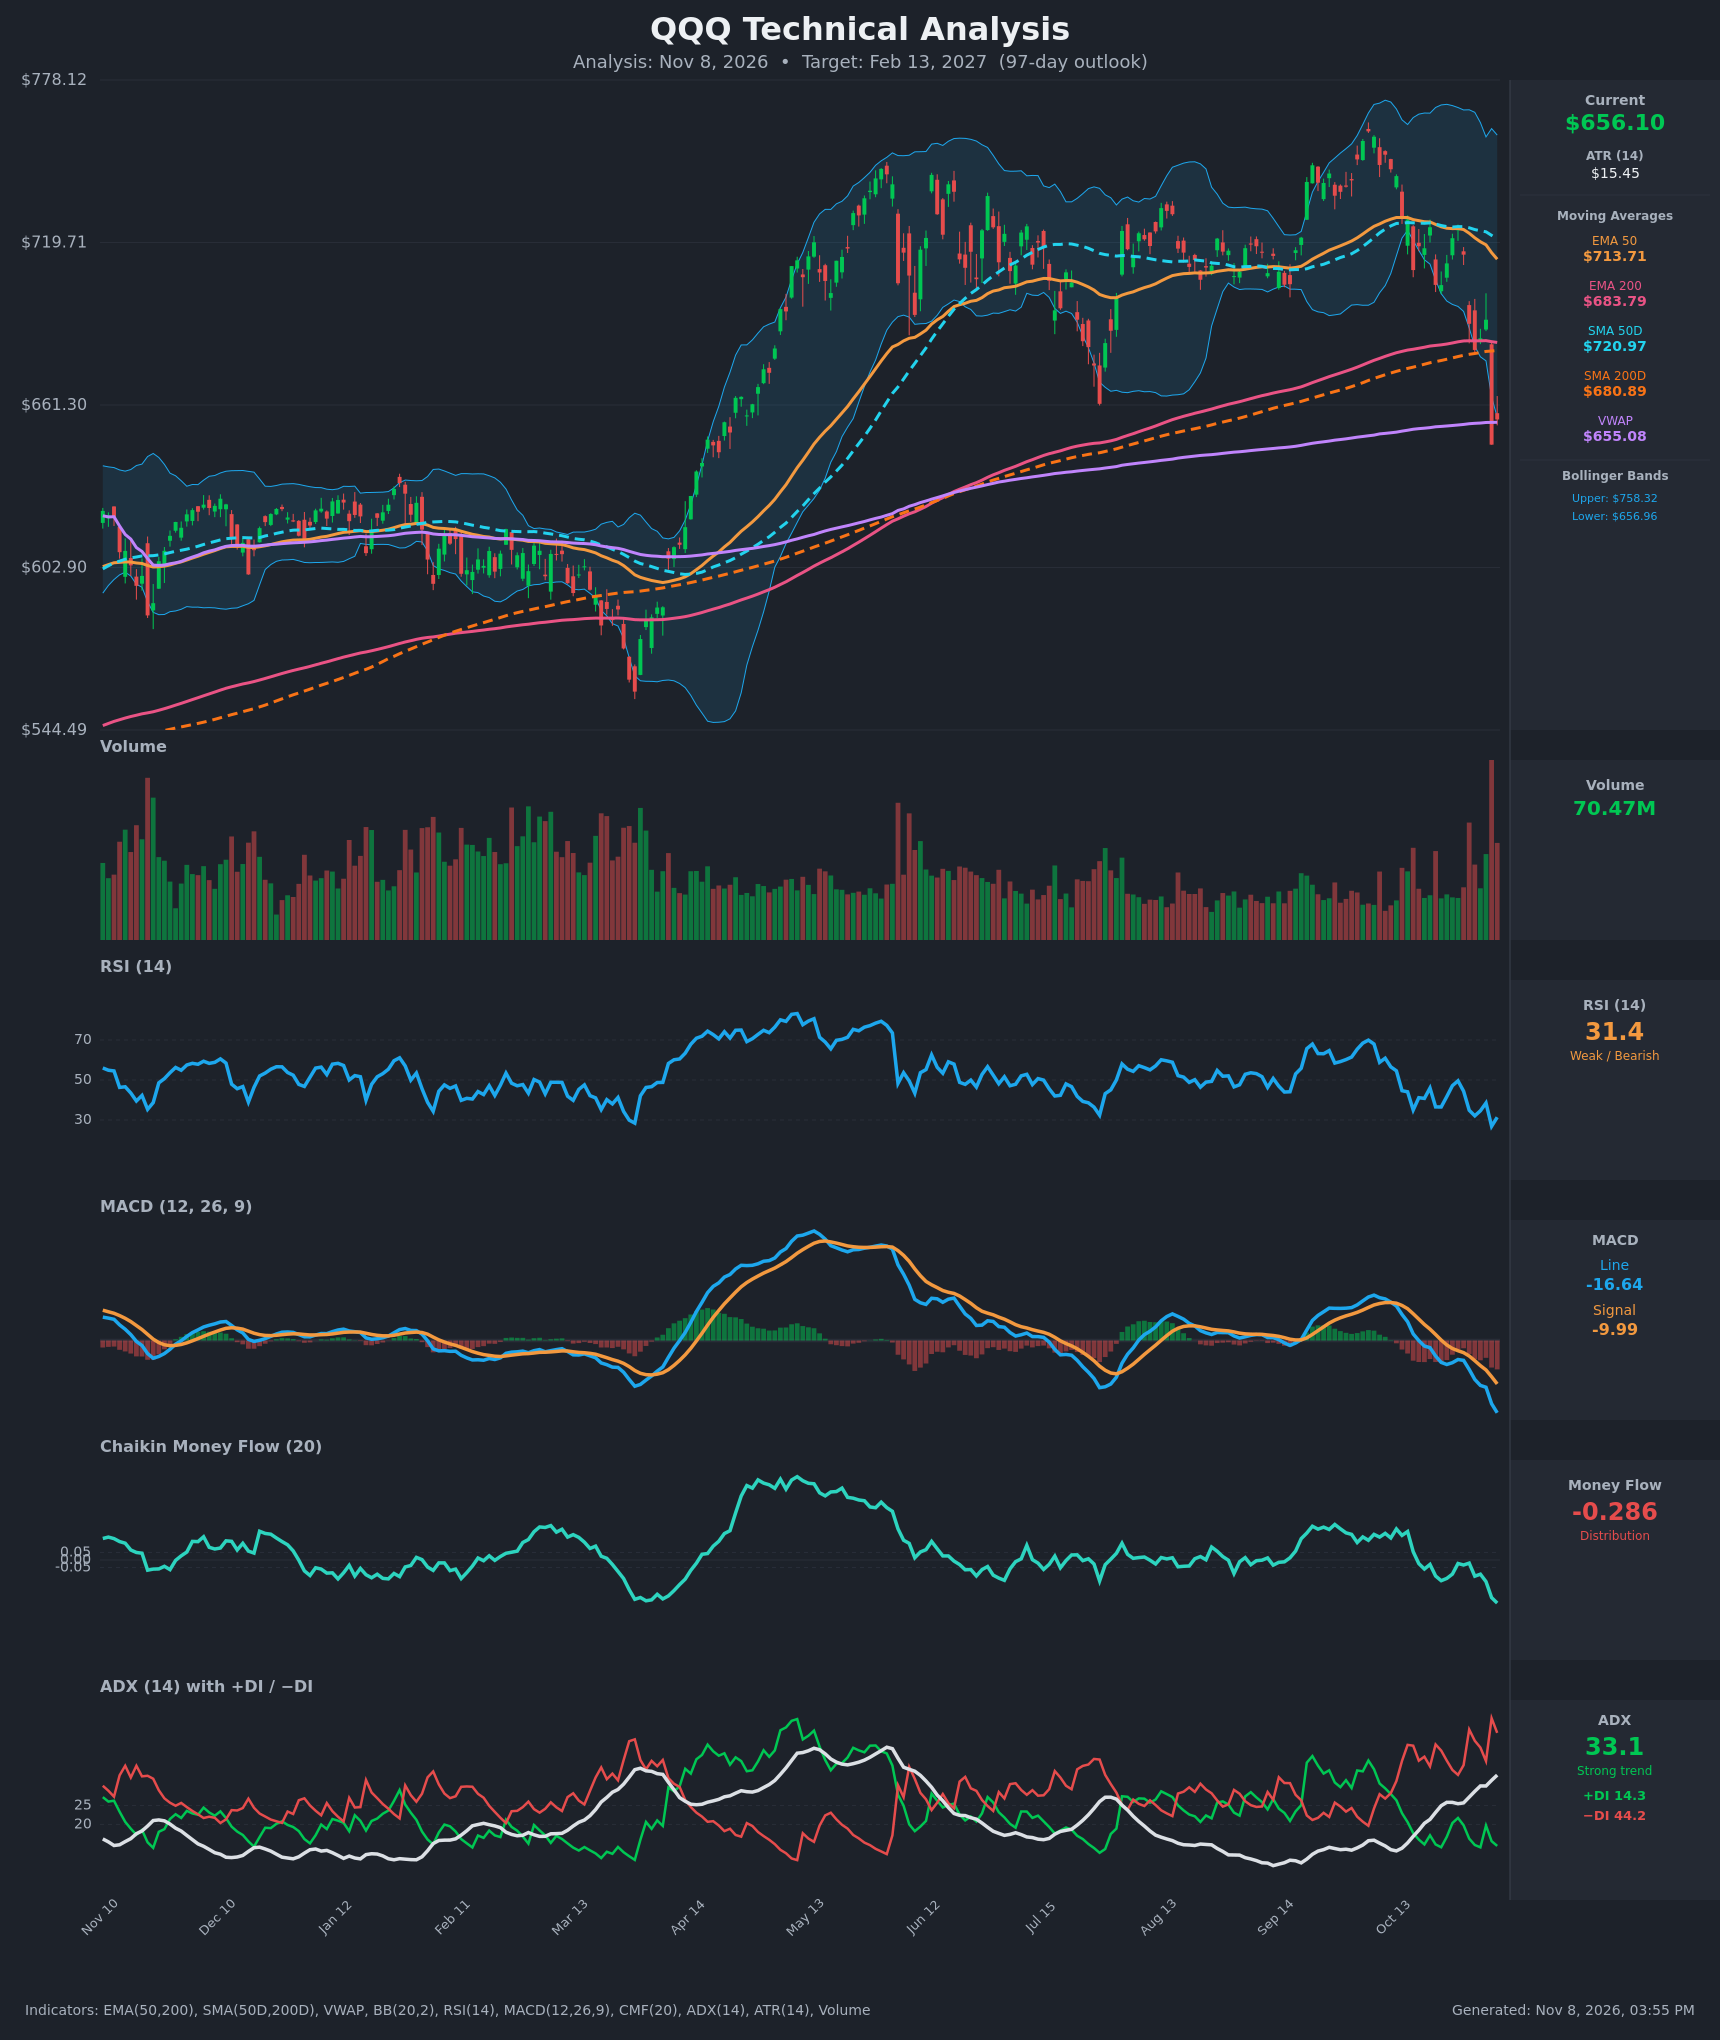
- RSI (14): 31.37, rebounding slightly from 26.9 on Nov 5 but still just above oversold. It has fallen from about 50 in late October, and the chart shows it making lower highs since the September peak. Oversold conditions can produce bounces, but momentum has not turned up in a lasting way. [Bearish]
- 20 EMA: The 20 EMA is not supplied. The nearest reference is the EMA 50 at $713.71 and falling, about 8.8% above price. The EMA 50 has been declining for 11 straight sessions, and price is well below it, so it now acts as heavy resistance. [Bearish]
- MACD: Line -16.64 is below signal -9.99, a histogram of about -6.6 that is widening. The bearish crossover happened on Oct 23-26, and the line is at its lowest level on the chart. Both lines are falling and below zero. [Bearish]
- Bollinger Bands (20): Upper $758.32, lower $656.96. Price at $656.10 sits just below the lower band after a Nov 5 close at $647.05 pierced it. The bands are wide (about $101), so volatility has expanded. A band walk lower after a breakdown is bearish, but a close back inside the band could trigger a mean-reversion bounce toward the midline (~$707). [Bearish]
- CMF (20): -0.286, well below -0.05 and the weakest reading on the chart apart from the March trough. It has fallen steadily from near zero in mid-October, so selling pressure is heavy and persistent. [Distribution]
- ADX (14): 33.1 and rising from 18.5 on Oct 19, so this is a strong, strengthening trend. −DI (44.2) is far above +DI (14.3), a spread of about 30 points, so bears are firmly in control. [Strong Trend – Bearish]
- Volume: 70.47M, with a very large red bar on the breakdown day. This is the highest volume on the chart in months. Price closed at $656.10, above the Nov 5 low of $647.05, which hints at some capitulation. Volume is still confirming the breakdown, not a reversal. [Bearish – heavy distribution, possible capitulation]
- Moving averages and VWAP: Price is below EMA 50 ($713.71), SMA 50D ($720.97), EMA 200 ($683.79) and SMA 200D ($680.89), so it has lost the long-term trend line. It sits just above VWAP ($655.08), which is the only support in the immediate area. [Bearish]
DIVERGENCES & TRENDS
- No bullish divergence yet. RSI made a slightly higher low on Nov 6 (31.4) than on Nov 5 (26.9) only because of the one-day bounce. MACD and CMF are still making new lows with price, so momentum confirms the price decline.
- Moving average structure: Neither a death cross nor a golden cross has occurred. The EMA 50 ($713.71) is still above the EMA 200 ($683.79), but the gap has narrowed from about $45 to about $30 in two weeks. The SMA 50D is $40 above the SMA 200D, and that gap is also shrinking. A death cross is plausible within 4-8 weeks if price does not recover quickly.
- Breakdown: Price lost the 200-day cluster ($681-$684) on Nov 5 on heavy volume. Since Oct 30, price has fallen from about $725 to $656, a drop of roughly 10% in seven sessions.
- DI and ADX: −DI has been above +DI since mid-October. ADX is rising through 25 into the low 30s, which confirms a trend, not a choppy pullback.
- Failed highs: The October high around $770 (upper Bollinger area) was a lower-momentum retest of the spring highs. RSI peaked near 68-70 in October versus about 75-80 in April-May, which is a bearish divergence on the larger timeframe.
CHART PATTERNS
- Bearish Double Top / Triple Top zone (reversal): The April-May rally to roughly $750-$760 and the October rally to about $770 form a broad double-top. The "neckline" is the July swing low near $661, which price is now testing and breaking. A measured move equals the pattern height ($770 − $661 ≈ $109), which points toward about $550. That is a long-term extension, and I treat about $570-$600 as the realistic zone for this timeframe.
- Bearish breakdown through the 200-day: Price has closed below both 200-period averages after a failed retest, which is a classic transition from uptrend to corrective phase.
- Counter-pattern risk: If price reclaims $681-$684 quickly, the move could be read as a failed breakdown or bear trap, and the next target would be the $713 EMA 50.
POTENTIAL SCENARIOS
- Scenario 1: Bearish Breakdown Continuation — Price loses the Nov 5 low and the July swing low, then drifts toward the measured-move area as the moving averages roll over and a death cross forms. Trigger: close below $647 on above-average volume. Target: $585-$600, with an extension to $565. Invalidation: weekly close back above $684. (45% probability)
- Scenario 2: Bullish Oversold Relief Rally / Bear Trap — RSI under 30 and the volume climax lead to a snap-back. Price reclaims the 200-day cluster and rallies into the EMA 50 and the Bollinger midline. Trigger: close above $684 with CMF improving above -0.10. Target: $710-$720. Invalidation: rejection at $684-$700 and a new low below $647. (30% probability)
- Scenario 3: Neutral Choppy Base — After the capitulation, price oscillates between $630 and $690 for weeks as ADX fades from its peak. Trigger: failure to break either $647 or $684 for several weeks. Target: $640-$670. Invalidation: close outside $625-$695. (25% probability)
PRICE TARGETS
- Target Price: $630.00 (97 days, about -4.0% from current)
- Expected Range: $565.00 to $710.00 (width $145 = about 22.1% of current price, consistent with the 61-180 day guidance of 18-30%)
- Key Levels: Support at $647.05, Resistance at $683.79
OVERALL BIAS
OVERALL BIAS: BEARISH - Price has broken below all major moving averages and the 200-day cluster on very heavy volume. MACD is deeply negative, CMF shows strong distribution (-0.286), and ADX of 33 with −DI far above +DI confirms a strong downtrend. The oversold RSI (31) argues for a bounce along the way, but the evidence favors lower prices over 97 days.
This is educational analysis and not financial advice.