SMCI 97-day bearish forecast — Nov 8, 2026
- Bias: Bearish
- Timeframe: 97 days (made Nov 8, 2026, target date Feb 12, 2027)
- Price at analysis: $28.76
- Price target: $26.50
- Expected range: $22.50 – $30.50
- Result: Pending — graded after the close on Feb 12, 2027
Get a free AI analysis of SMCI today
Analysis
TECHNICAL INDICATORS
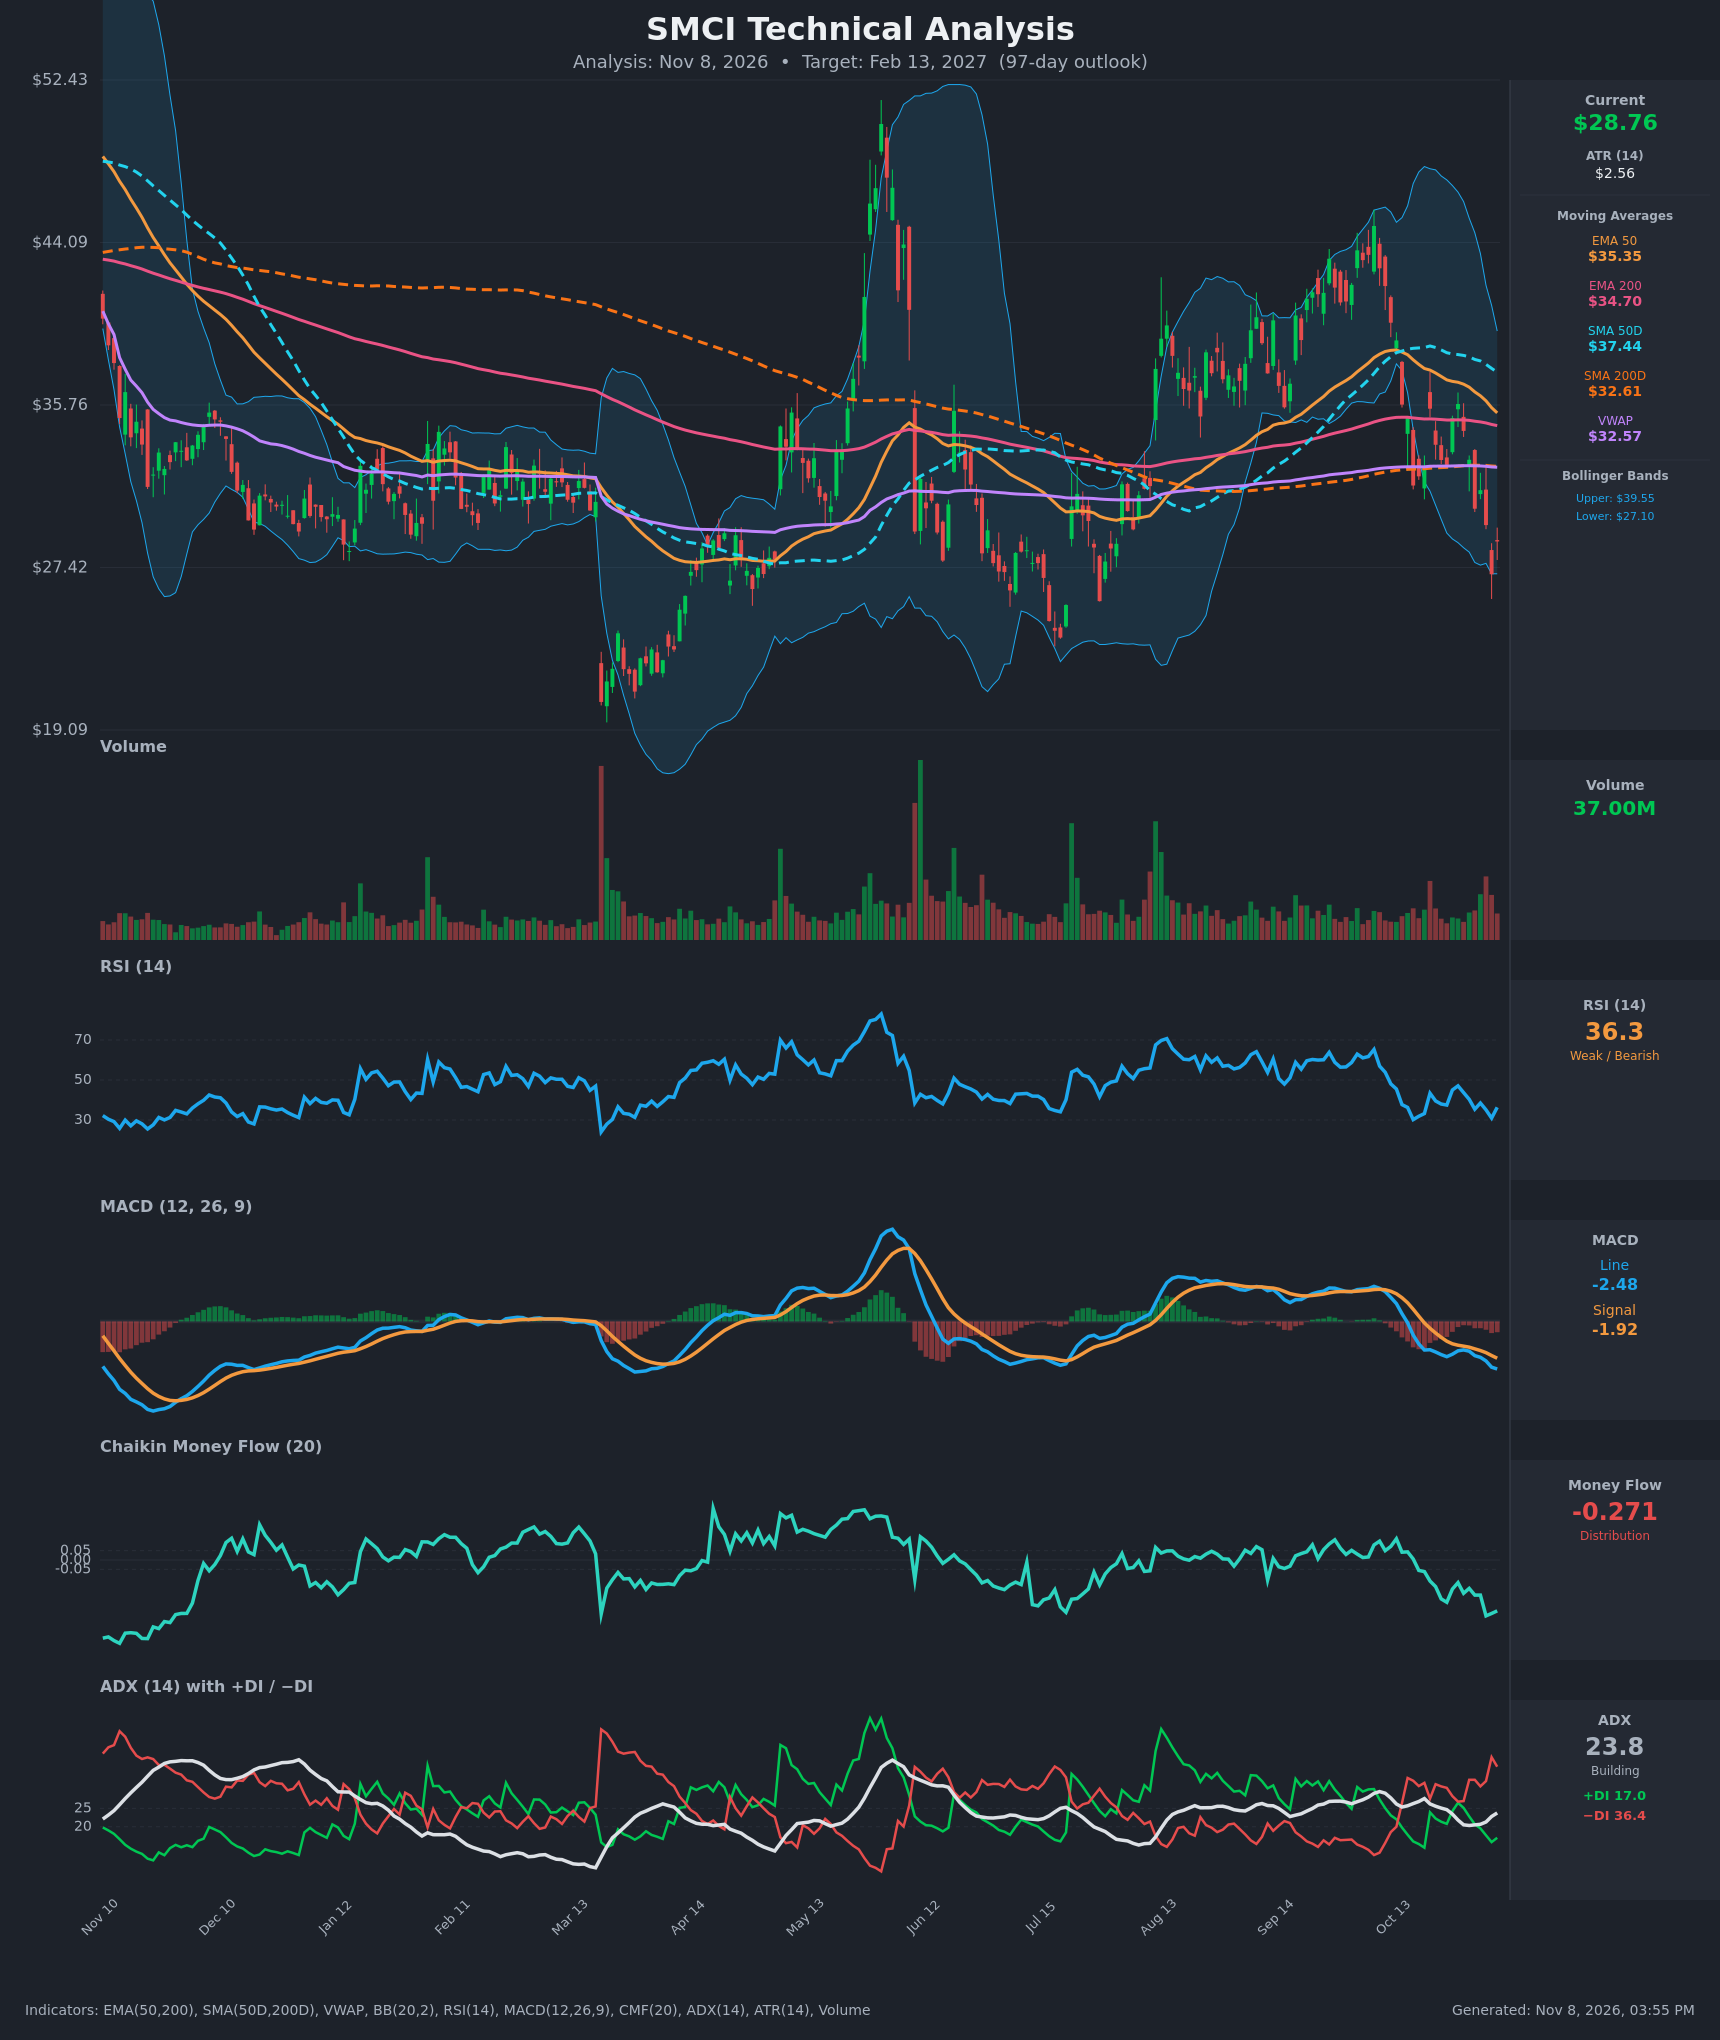
- RSI (14): 36.34, in the weak zone but not yet oversold (<30). It has made lower highs (47 → 38 → 36) since late October and briefly hit 31 on Nov 5. Momentum is bearish with a small bounce attempt. [Bearish]
- 20 EMA: Not supplied, so I use the EMA 50 at $35.36 as the nearest trend proxy. Price at $28.76 is about 19% below it, and the EMA 50 is sloping down, so it acts as overhead resistance. EMA 50 ($35.36) is only $0.65 above EMA 200 ($34.70) and the gap is closing fast, so a bearish EMA crossover looks imminent. [Bearish]
- MACD: Line -2.48 is below signal -1.92, and the histogram is negative and widening (about -0.56). The line has been below the signal since late October, and both are falling below zero. [Bearish]
- Bollinger Bands (20): Price is $28.76 against a lower band of $27.11 and an upper band of $39.55, so it sits in the lower quarter of the bands, about $4.60 below the midline (~$33.3). The bands are wide and starting to turn down. The Nov 5 close at $27.08 touched the lower band and bounced. This is a "walk the band" risk if $27 fails, but also a setup for a mean-reversion bounce. [Bearish]
- CMF (20): -0.271, well below -0.05 and falling steadily from about -0.06 in mid-October. This is sustained distribution and heavy selling pressure. [Distribution]
- ADX (14): 23.8 and rising (from 20.3), nearing the 25 threshold. −DI at 36.4 is far above +DI at 17.0, so bears control and the downtrend is gaining strength. [Strong/Building Trend – Bearish]
- Volume: 37.00M, elevated compared with the prior months, with the heaviest bars on the red candles of the past two weeks. The rise in volume on the decline confirms the selling. [Bearish – distribution]
Other trend signals:
- Price is below the SMA200D ($32.61), the VWAP ($32.57), the EMA 50, the EMA 200 and the SMA50D ($37.44), so it is under every major average.
- The SMA50D has rolled over and is falling toward the SMA200D. A death cross (SMA50D crossing below SMA200D) has not happened yet but is plausible over the next 2-3 months.
DIVERGENCES & TRENDS
- No bullish divergence yet. RSI made a slightly higher low on Nov 5 (31.0) compared with the Oct 19-20 lows (31.9-33.2), which is roughly equal, so there is no clean bullish divergence. MACD and CMF are making new lows, which confirms the price weakness.
- Lower highs in price. The May spike (~$50) was followed by a lower high in September (~$46) and now a break below the Aug-Oct rising structure. The Oct 21 and Oct 28 bounces (to $35.57 and $35.81) both failed.
- Momentum. MACD is accelerating lower, CMF is deteriorating, and ADX is rising with −DI dominant. The +DI/−DI relationship has been bearish since Oct 22 apart from a brief near-cross on Oct 28.
- Crossovers.
- The MACD bearish cross is in place.
- A bearish EMA 50 / EMA 200 cross is close.
- Price has fallen back below the SMA200D after briefly holding above it in the Aug-Oct rally.
- Mitigating factors. RSI near 30 and price near the lower Bollinger Band make a relief bounce toward $31-33 likely at some point. The big support zone at ~$27 held on the Nov 5 intraday low.
CHART PATTERNS
- Bearish Double Top / lower-high structure (reversal). The May peak (~$50) and the lower September peak (~$46) form a broad failed-rally structure. The breakdown out of the Aug-Oct rising channel resembles a Bearish Flag/Rising Wedge completion: price broke the rising channel in mid-October and has since made lower lows.
- Key neckline: ~$27. This area is the Nov 5 low and the lower Bollinger Band. A confirmed close below it opens the measured move toward the $23-24 zone (the Jul lows near $23-25), and potentially the $20-22 area (the March-April lows).
- Invalidation of the pattern: a reclaim of the SMA200D/VWAP cluster at ~$32.6, which would suggest a failed breakdown and a range-bound trade between $27 and $36.
POTENTIAL SCENARIOS
- Scenario 1: Bearish Continuation Breakdown — Price remains below all major averages, MACD and CMF stay negative, and the $27 neckline gives way. Sellers keep control (−DI > +DI) and the stock re-tests the summer lows. Trigger: daily close below $27.00 on above-average volume. Target: $24.00-$25.00, with an extension to ~$22.50. Invalidation: daily close above $32.60 (SMA200D/VWAP). (50% probability)
- Scenario 2: Bullish Oversold Relief Rally — RSI near 30 and a lower-band bounce produce a mean-reversion rally into the declining moving averages, where sellers re-emerge. Trigger: close above $31.40 (the Nov 3 level), then above $32.60. Target: $32.60-$35.00 (SMA200D/VWAP to EMA 50/200 zone). Invalidation: close below $27.00. (28% probability)
- Scenario 3: Neutral Base Building — Price chops between $26 and $31 as selling exhausts but no catalyst emerges. Trigger: repeated holds of $27 with fading volume and ADX falling below 20. Target: $27.00-$30.50. Invalidation: close outside the $26-$32.60 band. (22% probability)
PRICE TARGETS
Range width check: $30.50 - $22.50 = $8.00, which is 27.8% of $28.76. This fits the 61-180 day guidance of ~18-30%.
- Target Price: $26.50 (Feb 13, 2027, 97 days out)
- Expected Range: $22.50 to $30.50
- Key Levels: Support at $27.00, Resistance at $32.60
OVERALL BIAS
OVERALL BIAS: BEARISH - Price is below every major average (including the SMA200D), MACD is below its signal and falling, CMF is at -0.27 (heavy distribution), and −DI (36.4) dominates +DI (17.0) with ADX rising. The main risk is an oversold bounce toward $32.60, but the trend structure favors a re-test of lower support if $27 breaks.
This is educational analysis and not financial advice.