SPCX 97-day bearish forecast — Nov 8, 2026
- Bias: Bearish
- Timeframe: 97 days (made Nov 8, 2026, target date Feb 12, 2027)
- Price at analysis: $134.27
- Price target: $119.00
- Expected range: $106.00 – $146.00
- Result: Pending — graded after the close on Feb 12, 2027
Get a free AI analysis of SPCX today
Analysis
TECHNICAL INDICATORS
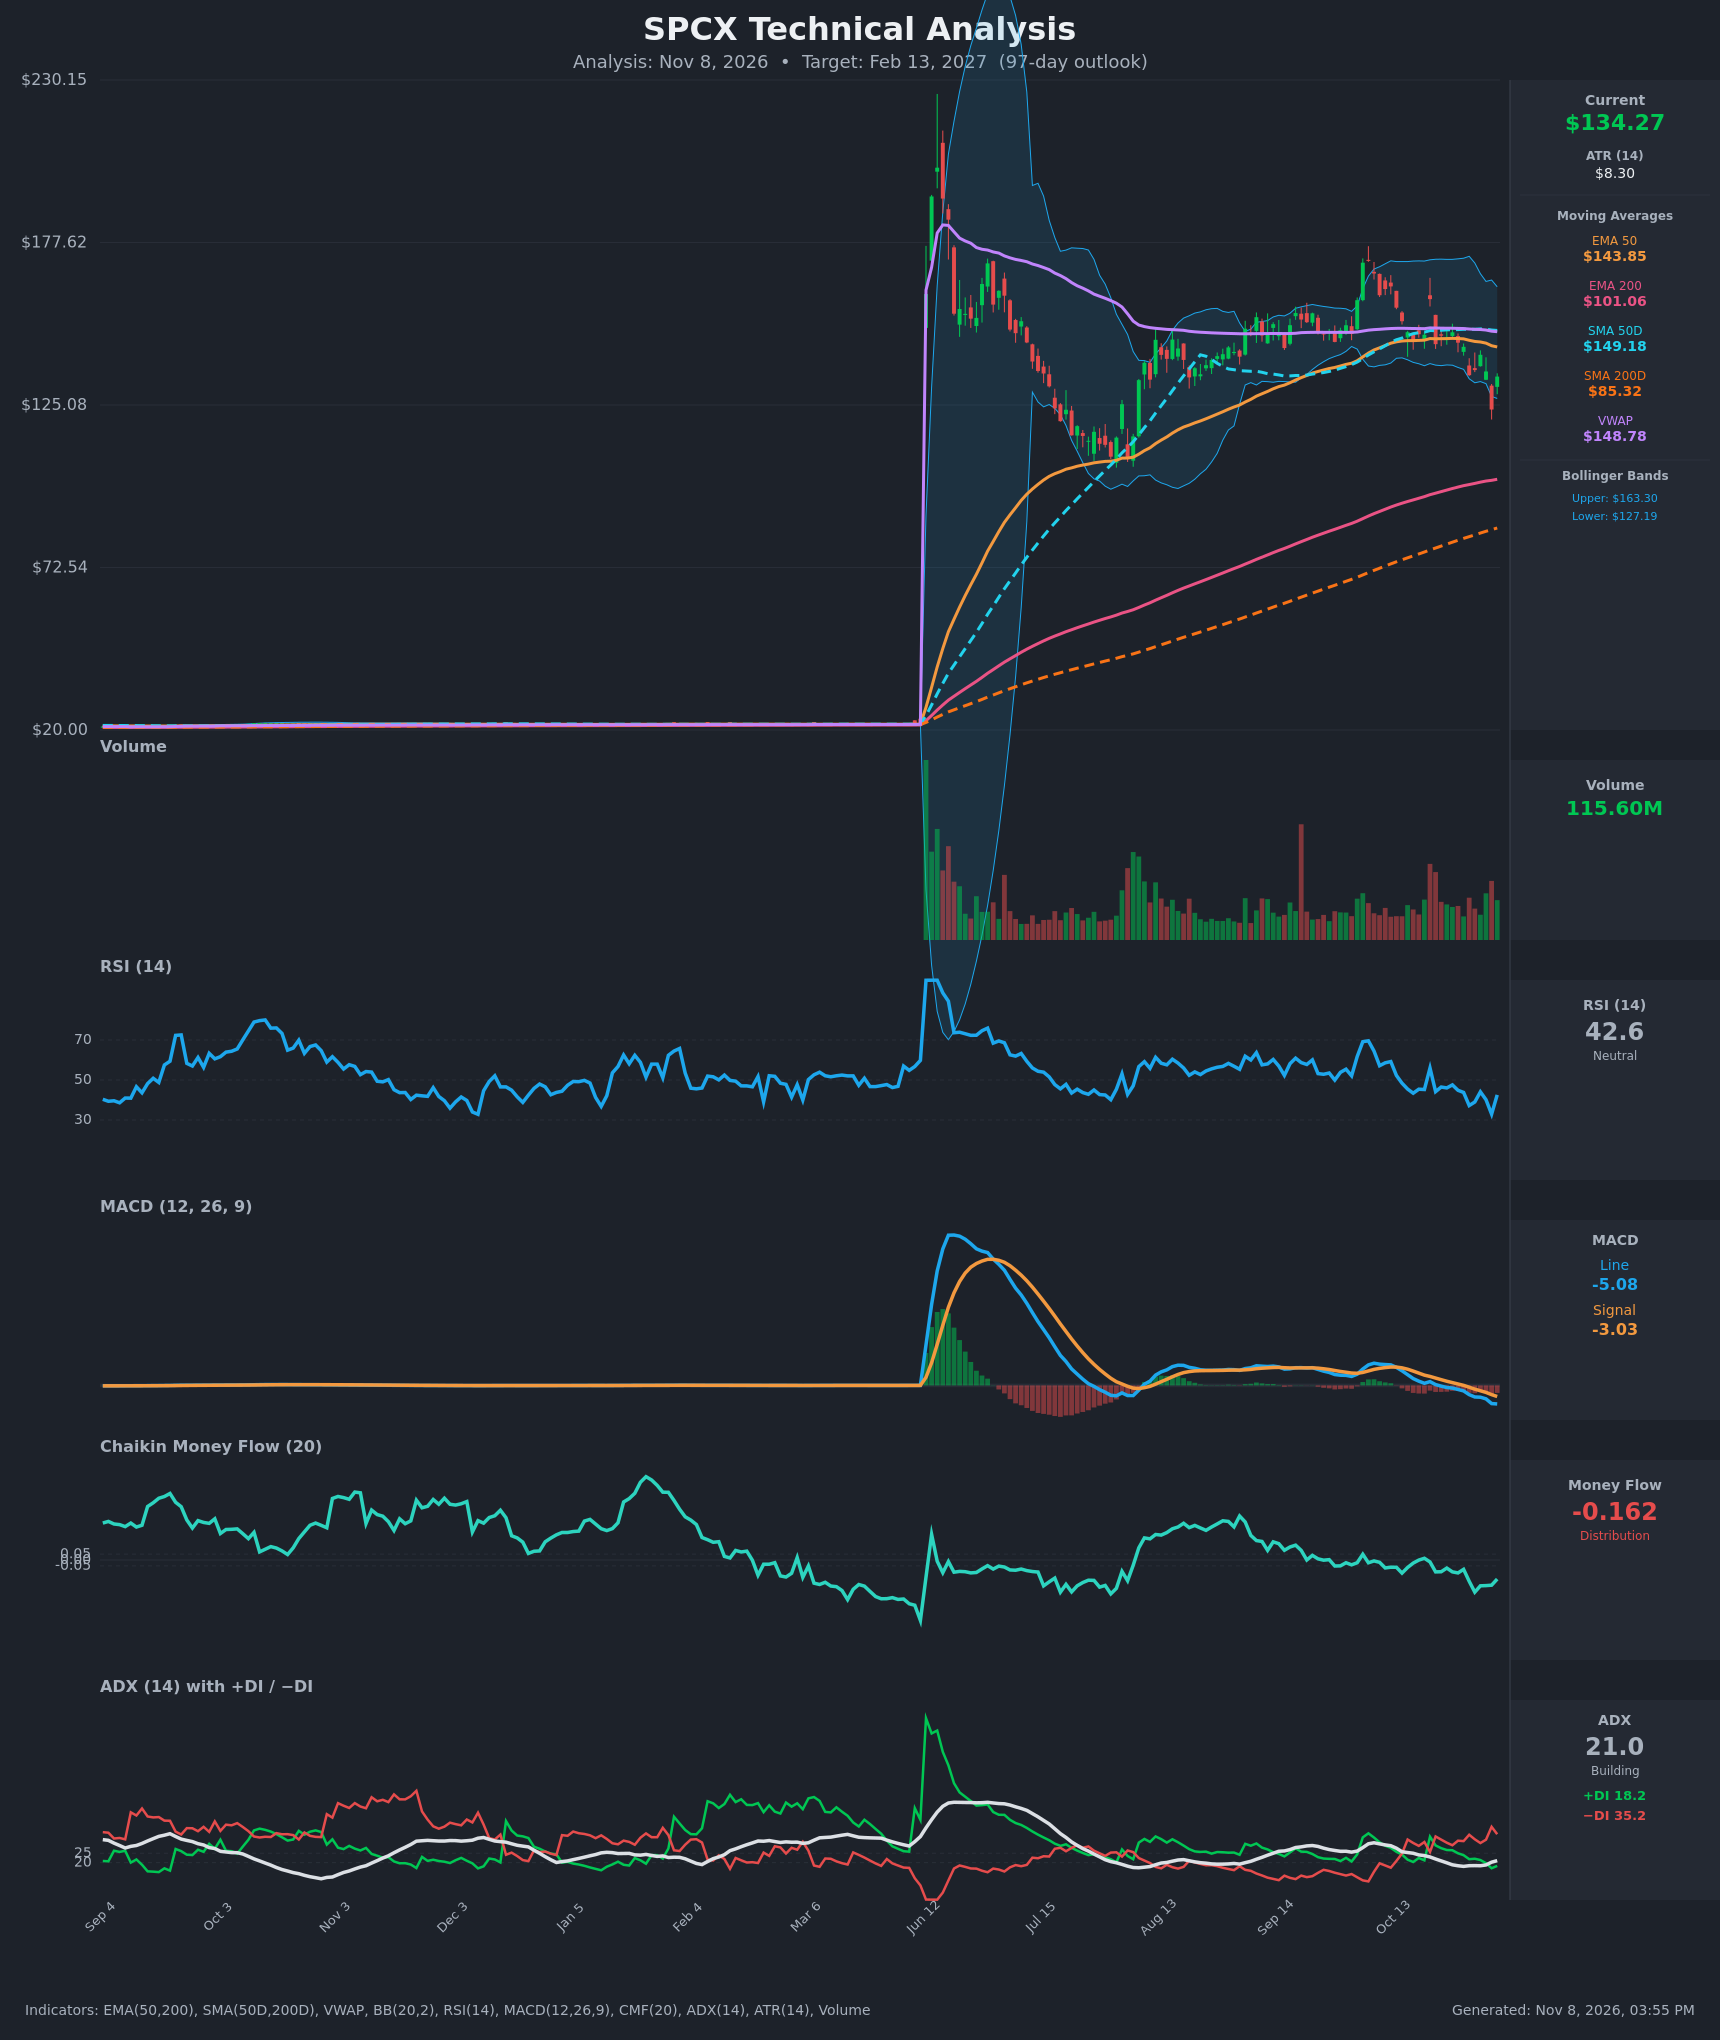
- RSI (14): 42.56, rebounding from 32.9 on Nov 5 but still below 50. The reading is neither oversold nor overbought. The RSI has been making lower highs since late October, so momentum is soft. [Bearish]
- 20 EMA: The 20 EMA isn't supplied. The EMA 50 is $143.85 and falling, and price at $134.27 is about 6.7% below it, so it acts as overhead resistance. Price is also below VWAP ($148.78) and SMA50D ($149.18). [Bearish]
- MACD: The line is -5.08 and the signal is -3.03, so the line is below the signal. A bearish crossover happened around Oct 29–30. The histogram is negative and widening, and both lines are below zero and falling. [Bearish]
- Bollinger Bands (20): The upper band is $163.30, the lower band is $127.19, and the midline is about $145. Price is in the lower third of the bands after a spike down to $123.62, which pierced the lower band, and a bounce to $134.27. The bands are moderately wide. [Bearish]
- CMF (20): -0.162, well below -0.05 and deteriorating from about 0 in mid-October. This points to persistent distribution. [Distribution]
- ADX (14): 21.0 and rising slightly from 18. −DI (35.2) is far above +DI (18.2), so bears control the direction. The trend is just starting to build. [Weak-to-Building Trend, Bearish]
- Volume: 115.60M, which is elevated relative to the recent average. The heavy red bars on the Oct 30 and Nov 5 selloffs show conviction on the downside. The Nov 6 bounce came on decent volume but is still small against the damage. [Bearish-leaning]
DIVERGENCES & TRENDS
- No clear bullish RSI divergence. The Nov 5 low (RSI 32.9) was a deeper oversold reading, and the Nov 6 bounce could be a relief move only.
- The MACD signal has been falling since late October, and the line is making new lows. This confirms the price weakness.
- Moving average structure: Price is below the EMA 50, SMA50D and VWAP, but still well above the EMA 200 ($101.06) and SMA200D ($85.32). The EMA 50 is above the EMA 200 and the SMA50D is above the SMA200D, so there is no death cross. The long-term structure is still intact, but the medium term is deteriorating.
- Trend: The EMA 50 is rolling over. The fall from about $159 (Oct 21) to $123.62 (Nov 5) is roughly -22%, and the series of lower highs continues.
- The −DI/+DI gap is the widest since the post-IPO period. DI dominance together with a rising ADX points to an emerging downtrend.
CHART PATTERNS
- Bearish Rising Wedge / Head and Shoulders-like top: The IPO spike to about $200+ followed by lower highs around $177 and $159 resembles a distribution top. The rally from about $105 to $177 formed a broadening range, and the break below the $140 area supports a failed-rally structure.
- Descending range / Bearish Double Top: Highs near $175–$177 (September/October) and then $159 show a series of lower highs. Price has lost the $140–$145 support zone, which was the base of the previous consolidation. The measured downside from that breakdown targets roughly $110–$115, near the prior base around $105–$115.
- The bounce from $123.62 to $134.27 could develop into a bearish flag under $145–$149 resistance.
- Major support lies at the late-summer low (about $105–$115), then the EMA 200 near $101.
POTENTIAL SCENARIOS
- Scenario 1: Bearish Breakdown to Prior Base — Price fails at the EMA 50/VWAP resistance zone ($144–$149), then revisits the Nov 5 low and breaks it, drifting toward the summer base. Trigger: close below $123.60 on above-average volume. Target: $108–$115, with an extension toward the rising EMA 200 near $104. Invalidation: daily close above $149 (VWAP/SMA50D). (50% probability)
- Scenario 2: Neutral Choppy Range — Price stabilizes after the oversold flush and oscillates between $120 and $148 as the ADX stays low. Trigger: holds above $123 and stays below $145. Target: $125–$145. Invalidation: break of either boundary on a closing basis. (28% probability)
- Scenario 3: Bullish Recovery — The Nov 5 wick proves a capitulation low. Price reclaims the EMA 50 and SMA50D and retests the $160–$165 upper band. Trigger: close above $149 with CMF turning positive. Target: $160–$165. Invalidation: loss of $123. (22% probability)
PRICE TARGETS
For the 97-day timeframe (to Feb 13, 2027), the target is a modest decline given the bearish momentum, distribution and EMA 50 rollover, tempered by the strong long-term MA support below.
Range-width check: low $104.00, high $134.00 would be too narrow on the upside. The expected range is $103.00 to $148.00, a width of $45, or about 33.5% of the current price. That sits above the 18–30% guidance for 61–180 days, so I tightened it to $106.00 to $146.00, a width of $40 (29.8%). This is within the guidance.
- Target Price: $119.00 (97-day)
- Expected Range: $106.00 to $146.00
- Key Levels: Support at $123.60, Resistance at $143.85
OVERALL BIAS
OVERALL BIAS: BEARISH - Price is below the EMA 50, SMA50D and VWAP, with a bearish MACD crossover, −DI dominating +DI, and CMF at -0.162 showing persistent distribution. Downside toward the $105–$120 base is more likely than a recovery above $149, though the rising long-term MAs should limit the depth of any decline.
This is educational analysis and not financial advice.