TSLA 97-day bearish forecast — Nov 8, 2026
- Bias: Bearish
- Timeframe: 97 days (made Nov 8, 2026, target date Feb 12, 2027)
- Price at analysis: $358.22
- Price target: $345.00
- Expected range: $295.00 – $400.00
- Result: Pending — graded after the close on Feb 12, 2027
Get a free AI analysis of TSLA today
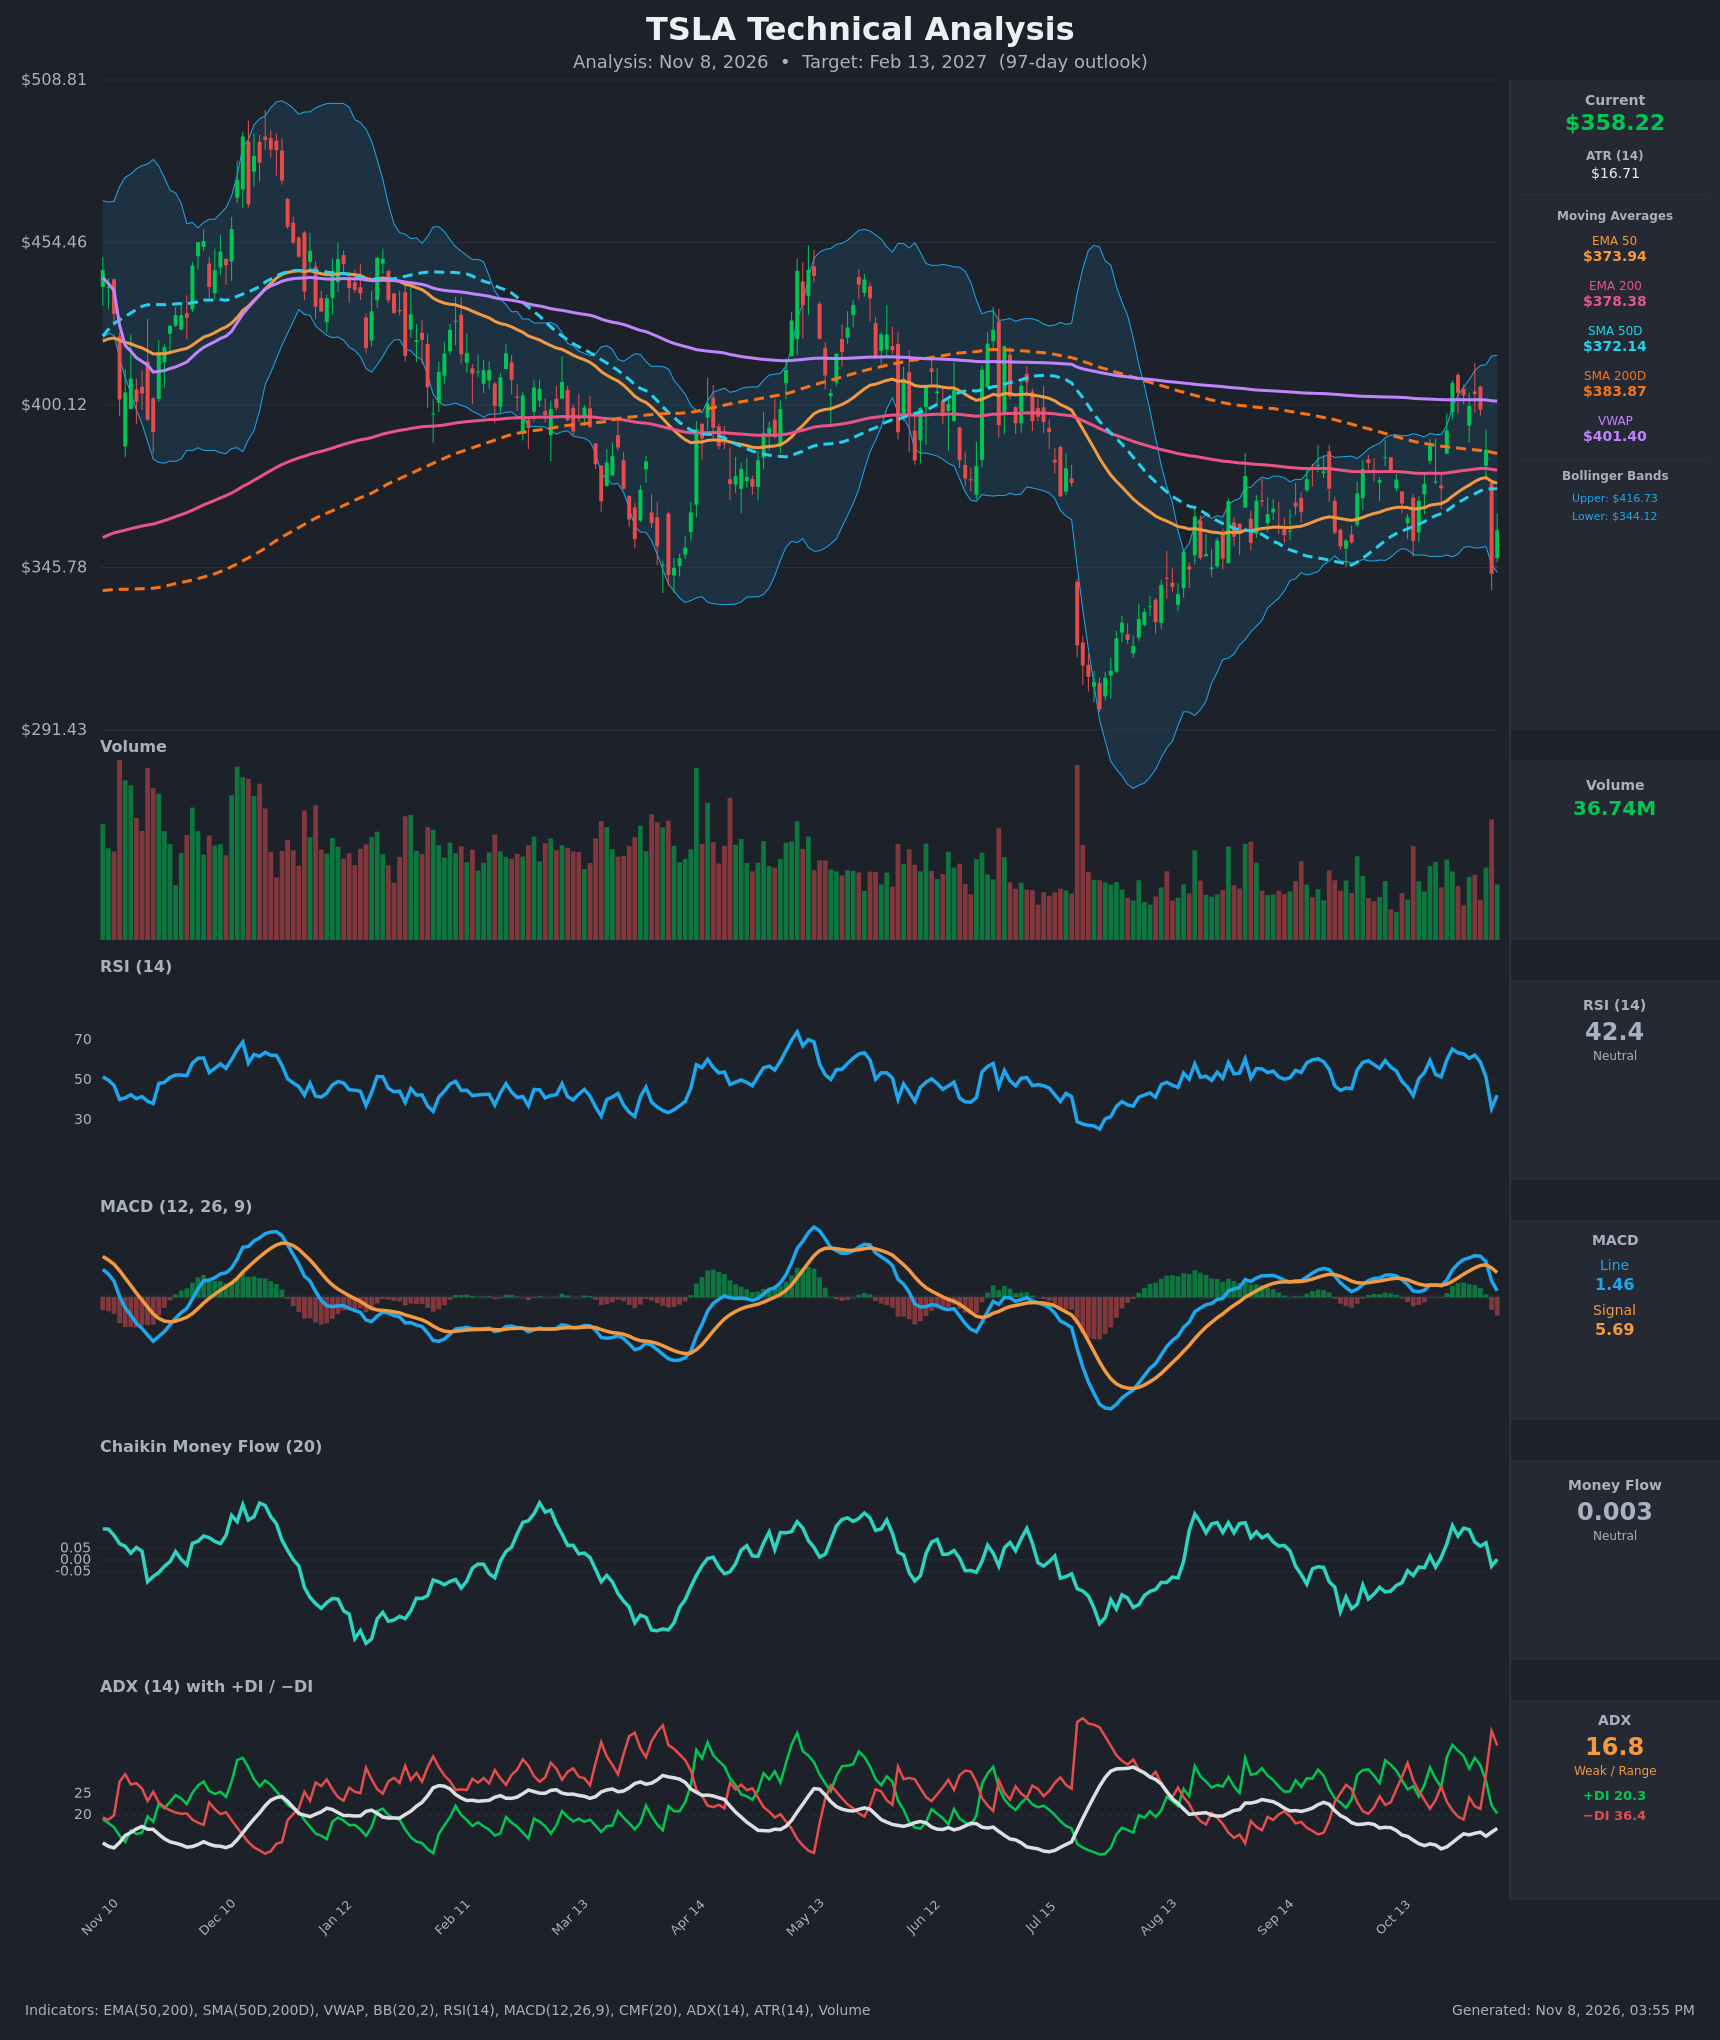
Analysis
TECHNICAL INDICATORS
- RSI (14): 42.39, down from about 65 in late October and a low of 35.8 on Nov 5. It is below the 50 midline but not oversold, and momentum is weakening with a small bounce off the low. [Bearish]
- 20 EMA: The 20 EMA value was not supplied. The 50 EMA at $373.94 is a proxy, and price at $358.22 is below it. The EMA50 is rolling over (peak $375.85 on Nov 4), so it now acts as overhead resistance. [Bearish]
- MACD: Line 1.46 is below Signal 5.69. A bearish crossover occurred on Nov 5 (3.79 vs 6.75), and the histogram is negative at about -4.2 and widening. The line is still marginally above zero, so the longer trend has not fully broken. [Bearish]
- Bollinger Bands (20): Upper $416.73, lower $344.12, midline about $380. Price is in the lower third of the bands, after a sharp reversal from the upper half in late October. The Nov 5 low of $343.69 pierced the lower band and bounced. The bands are moderately wide. [Bearish]
- CMF (20): 0.003, inside the neutral ±0.05 zone. It has fallen from +0.149 on Oct 27, so the accumulation has faded and is not yet distribution. [Neutral]
- ADX (14): 16.8 (below 20, a weak trend) with −DI 36.4 on top of +DI 20.3. The DI spread is wide and favors sellers. ADX is edging up from 12–13, which hints at a trend developing to the downside. [Weak Trend, Bearish Direction]
- Volume: 36.74M. The Nov 5 breakdown (-10.8%) came on a volume spike, the highest of recent weeks. Volume is lower on the Nov 6 bounce. Heavy selling on the breakdown with a lighter bounce points to distribution. [Bearish]
DIVERGENCES & TRENDS
- Moving averages: Price is below EMA50 ($373.94), EMA200 ($378.38), SMA50D ($372.14), SMA200D ($383.87) and VWAP ($401.40). These sit stacked in a $372–$384 resistance cluster overhead.
- Long-term trend: Price remains below the SMA200D, which signals a long-term downtrend. The SMA50D is below the SMA200D, so the death cross is still in force, though the gap has narrowed from the lows.
- Failed breakout: The late-October rally to $407 stalled just under the $416 upper band and VWAP at $401, and then reversed sharply. That is a classic failed breakout and bull trap.
- MACD: The bearish crossover on Nov 5 came just after a peak in MACD at 9.59 on Nov 2, so momentum has been fading since early November.
- DI: The DI crossover to −DI dominance (Nov 4–5) confirms the shift.
- No clear divergence: RSI and price have fallen together.
- Longer view: The chart shows a year of range-bound behavior between about $345 and $455, with a July flush to roughly $300, so support near $345 matters.
CHART PATTERNS
- Range/Bearish Double Top: Price made a high near $407 in late October and failed again near $400 on Oct 28–Nov 2. This resembles a minor Bearish Double Top with a neckline near $372–$385. The Nov 5 drop broke that neckline. The measured move (peak ~$407, neckline ~$375, height ~$32) projects to roughly $343, which is the same area as the lower Bollinger Band and the Nov 5 low.
- Broader structure: Since August, price has formed a higher-low rising channel in the $345–$410 zone. The Nov 5 candle closed at the bottom of that structure, and a break below $343 would invalidate the higher-low sequence and open a path toward the July low near $300 (Bearish Rising Wedge-like breakdown).
- Significance: The pattern favors a downside bias, with $343–$345 the first big test.
POTENTIAL SCENARIOS
- Scenario 1: Bearish Breakdown Below $344 Support — Failed breakout, a bearish MACD cross, −DI dominance and the double-top measured move all favor a retest and break of the Nov 5 low. Trigger: daily close below $343.70 on rising volume. Target: $315–$325, with an extension to the July low near $300. Invalidation: daily close above $384 (SMA200D). (45% probability)
- Scenario 2: Neutral Range Chop — Price consolidates between the $344 support and the $375–$384 MA cluster, with ADX staying weak. Trigger: repeated holds above $344 with rejection at the EMA50. Target: $345–$380. Invalidation: close outside $335–$390. (30% probability)
- Scenario 3: Bullish Recovery Over the MA Cluster — Buyers defend $344, the Nov 5 flush proves a capitulation, and price reclaims the SMA200D and then VWAP. Trigger: close above $384 with CMF above +0.05. Target: $400–$417 (upper band and VWAP). Invalidation: close below $344. (25% probability)
PRICE TARGETS
- Target Price: $345.00 (97 days)
- Expected Range: $295.00 to $400.00 (width $105 = 29.3% of price, consistent with the 61–180 day guidance of 18–30%)
- Key Levels: Support at $343.70 (then $300), Resistance at $373.94 (then $384)
OVERALL BIAS
OVERALL BIAS: BEARISH - Price is below all major moving averages and VWAP, with a bearish MACD cross, −DI far above +DI, and a high-volume breakdown after a failed rally into resistance. The $343–$345 support is the key level, and a break targets the $300–$325 area.
This is educational analysis and not financial advice.