TLT 97-day bullish forecast — Nov 8, 2026
- Bias: Bullish
- Timeframe: 97 days (made Nov 8, 2026, target date Feb 12, 2027)
- Price at analysis: $81.92
- Price target: $83.60
- Expected range: $74.50 – $91.50
- Result: Pending — graded after the close on Feb 12, 2027
Get a free AI analysis of TLT today
Analysis
TECHNICAL INDICATORS
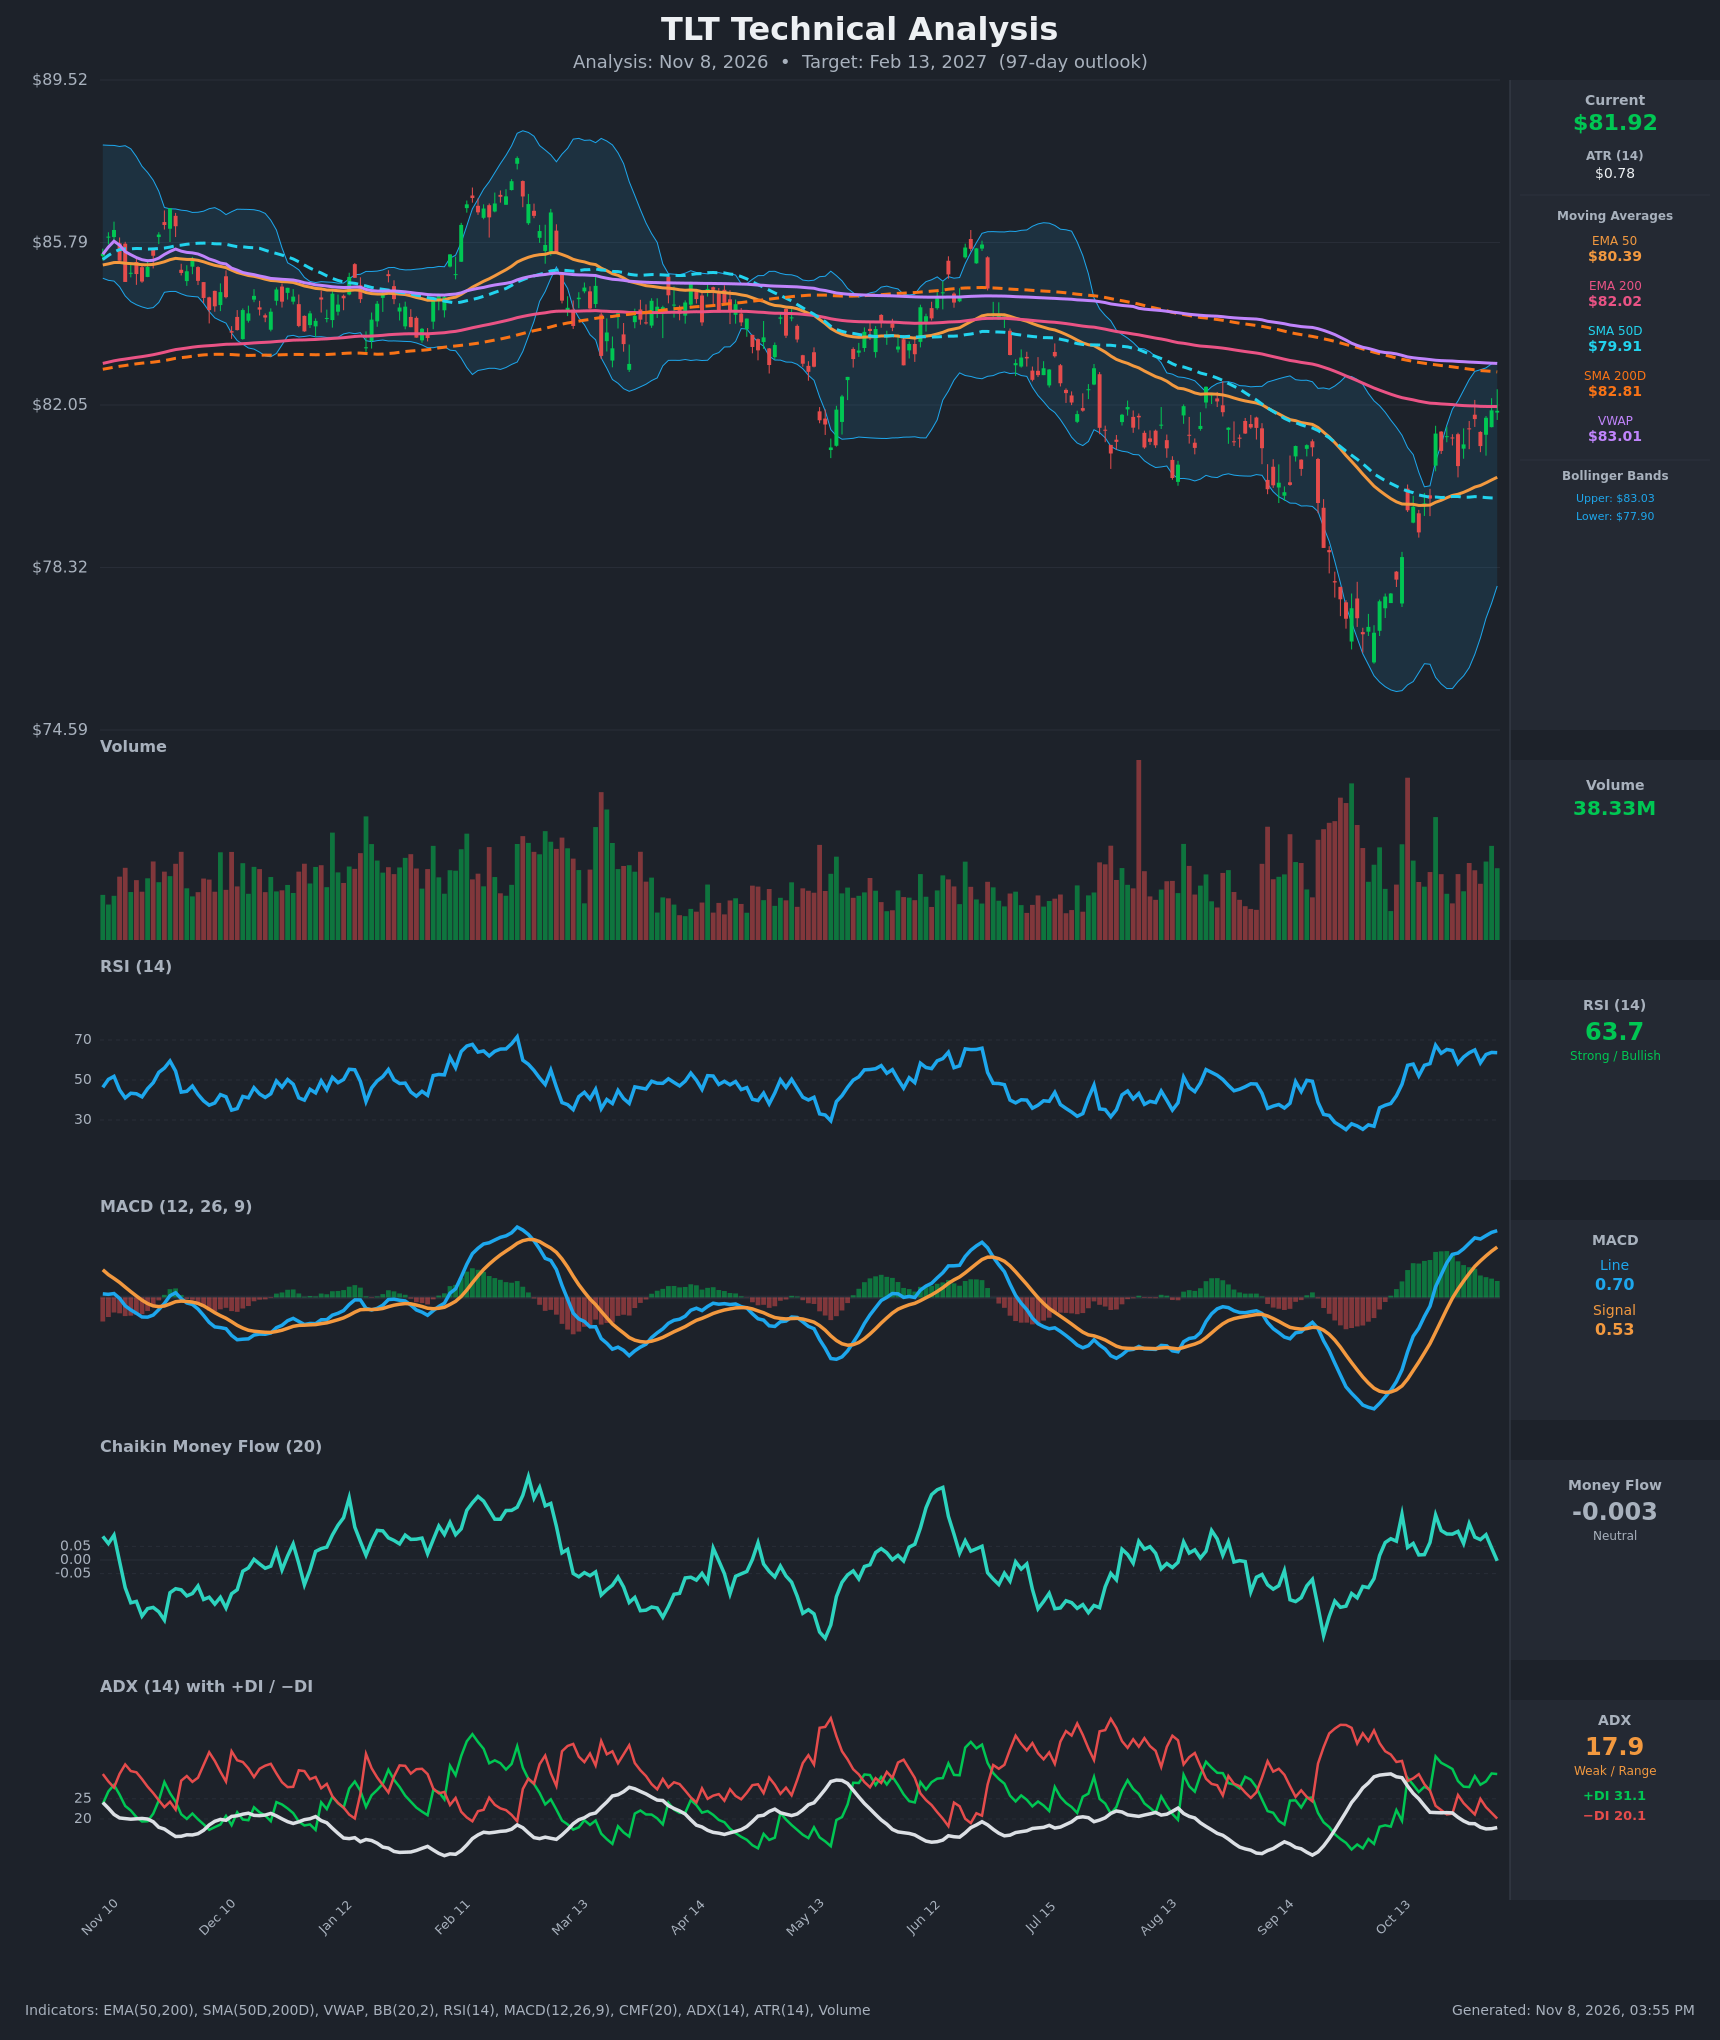
- RSI (14): 63.66, up from the low-50s in mid-October and holding in the 58-67 band for three weeks. Momentum is firmly positive but not yet overbought (>70). [Bullish]
- 20 EMA: The 20 EMA wasn't supplied, so I used the EMA 50 at $80.39 as the nearest trend reference. Price ($81.92) is about 1.9% above it and the EMA is rising, which makes it dynamic support. EMA 50 is still below EMA 200 ($82.02), so the longer-term structure remains bearish. [Bullish]
- MACD: Line 0.70 is above signal 0.53 and both are positive. The bullish crossover happened around Oct 22-27 and the gap is widening. The histogram is positive and the line is making new highs on the chart, though it is decelerating slightly. [Bullish]
- Bollinger Bands (20): Upper $83.03, lower $77.90, middle about $80.46. Price sits in the upper half, roughly 0.8 of the band width, after the bands expanded during the Sept-Oct selloff. The upper band at $83.03 lines up with VWAP and SMA 200, a heavy resistance cluster. [Neutral]
- CMF (20): -0.003, fading from +0.13 in late October to roughly zero. Price has risen without sustained buying pressure, a mild caution flag. [Neutral]
- ADX (14): 17.9 and falling, so the trend is weak or range-bound. +DI (31.1) is well above −DI (20.1), so bulls hold directional control, but the low ADX means there is no confirmed trend. [Weak Trend, bullish lean]
- Volume: 38.33M, around average. Volume spiked on the late-September/early-October capitulation low and has since been moderate and mixed on the rebound. The bounce lacks strong volume confirmation. [Neutral]
DIVERGENCES & TRENDS
- No clean divergence: RSI and MACD have both made higher highs than the late-summer levels as price recovered. Price has made a higher low (~$76.3 → current) with momentum confirming.
- CMF lag: CMF is rolling over toward zero while price pushes up, a minor negative divergence in money flow.
- ADX falling: ADX has dropped from 25 to 17.9 even as the price recovers, so the bounce is a corrective rally, not a new trend.
- Moving average structure:
- SMA 50 ($79.91) is below SMA 200 ($82.81), a death-cross state.
- EMA 50 is below EMA 200.
- Price is below SMA 200 and VWAP ($83.01), so the long-term trend is still down.
- Price is just below EMA 200 ($82.02) and above EMA 50 and SMA 50.
- Recent crossovers:
- The MACD bullish crossover occurred in late October.
- +DI crossed above −DI on Oct 21-22 and has stayed there.
- The SMA 50 has flattened and is curling up.
CHART PATTERNS
- Bullish Falling Wedge / V-shaped reversal (reversal): The decline from the summer highs formed a downward-sloping channel with lower highs and lows. The sharp rebound off the ~$76.3 low and the reclaim of the 50-period averages fit a falling-wedge break. The measured target is the wedge's start, around $85-86.
- Resistance zone: The pattern is not confirmed until price closes decisively above the $82.0-$83.0 cluster (EMA 200, SMA 200, VWAP, upper Bollinger band).
- Broader context: Since February, price has made lower highs from about $86 to $82. A rejection here would fit a Bearish Rising Wedge or Descending Triangle continuation.
POTENTIAL SCENARIOS
- Scenario 1: Bullish Breakout of the Moving Average Cluster — Price clears the EMA 200/SMA 200/VWAP confluence and the falling wedge resolves upward. Trigger: daily close above $83.10 with volume above ~40M and CMF above +0.05. Target: $85.50-$86.00 (prior swing highs, wedge measured move). Invalidation: close below $80.00. (45% probability)
- Scenario 2: Bearish Rejection at Long-Term Resistance — The rally stalls at $82-83, the death-cross structure reasserts itself, and price rolls over toward the lows. Trigger: rejection at $83 followed by a close below the EMA 50 (~$80.40) and MACD crossing below signal. Target: $78.00, then $76.30. Invalidation: close above $83.50. (30% probability)
- Scenario 3: Neutral Range Consolidation — With ADX below 20, price chops between the EMA 50 and the $83 cluster. Trigger: repeated failures at $83 and holds at $80.40. Target: $80.00-$83.00. Invalidation: a close outside $79.50-$83.50. (25% probability)
PRICE TARGETS
- Target Price: $83.60 (97-day, Feb 13, 2027)
- Expected Range: $74.50 to $91.50 (width $17.00, about 20.8% of current price, consistent with the 61-180 day guidance)
- Key Levels: Support at $80.39, Resistance at $83.00
OVERALL BIAS
OVERALL BIAS: BULLISH - Momentum is positive (MACD above signal and rising, RSI in the low 60s, +DI well above −DI), price has reclaimed the EMA 50 and SMA 50, and the falling-wedge/V-reversal points to a retest of the mid-$80s. Conviction is modest because price is capped by the SMA 200/VWAP/upper-band cluster at $82-83, ADX is weak, CMF is flat, and the long-term moving average structure is still bearish.
This is educational analysis and not financial advice.