TQQQ 97-day bullish forecast — Nov 8, 2026
- Bias: Bullish
- Timeframe: 97 days (made Nov 8, 2026, target date Feb 12, 2027)
- Price at analysis: $52.25
- Price target: $56.50
- Expected range: $47.00 – $61.50
- Result: Pending — graded after the close on Feb 12, 2027
Get a free AI analysis of TQQQ today
Analysis
TECHNICAL INDICATORS
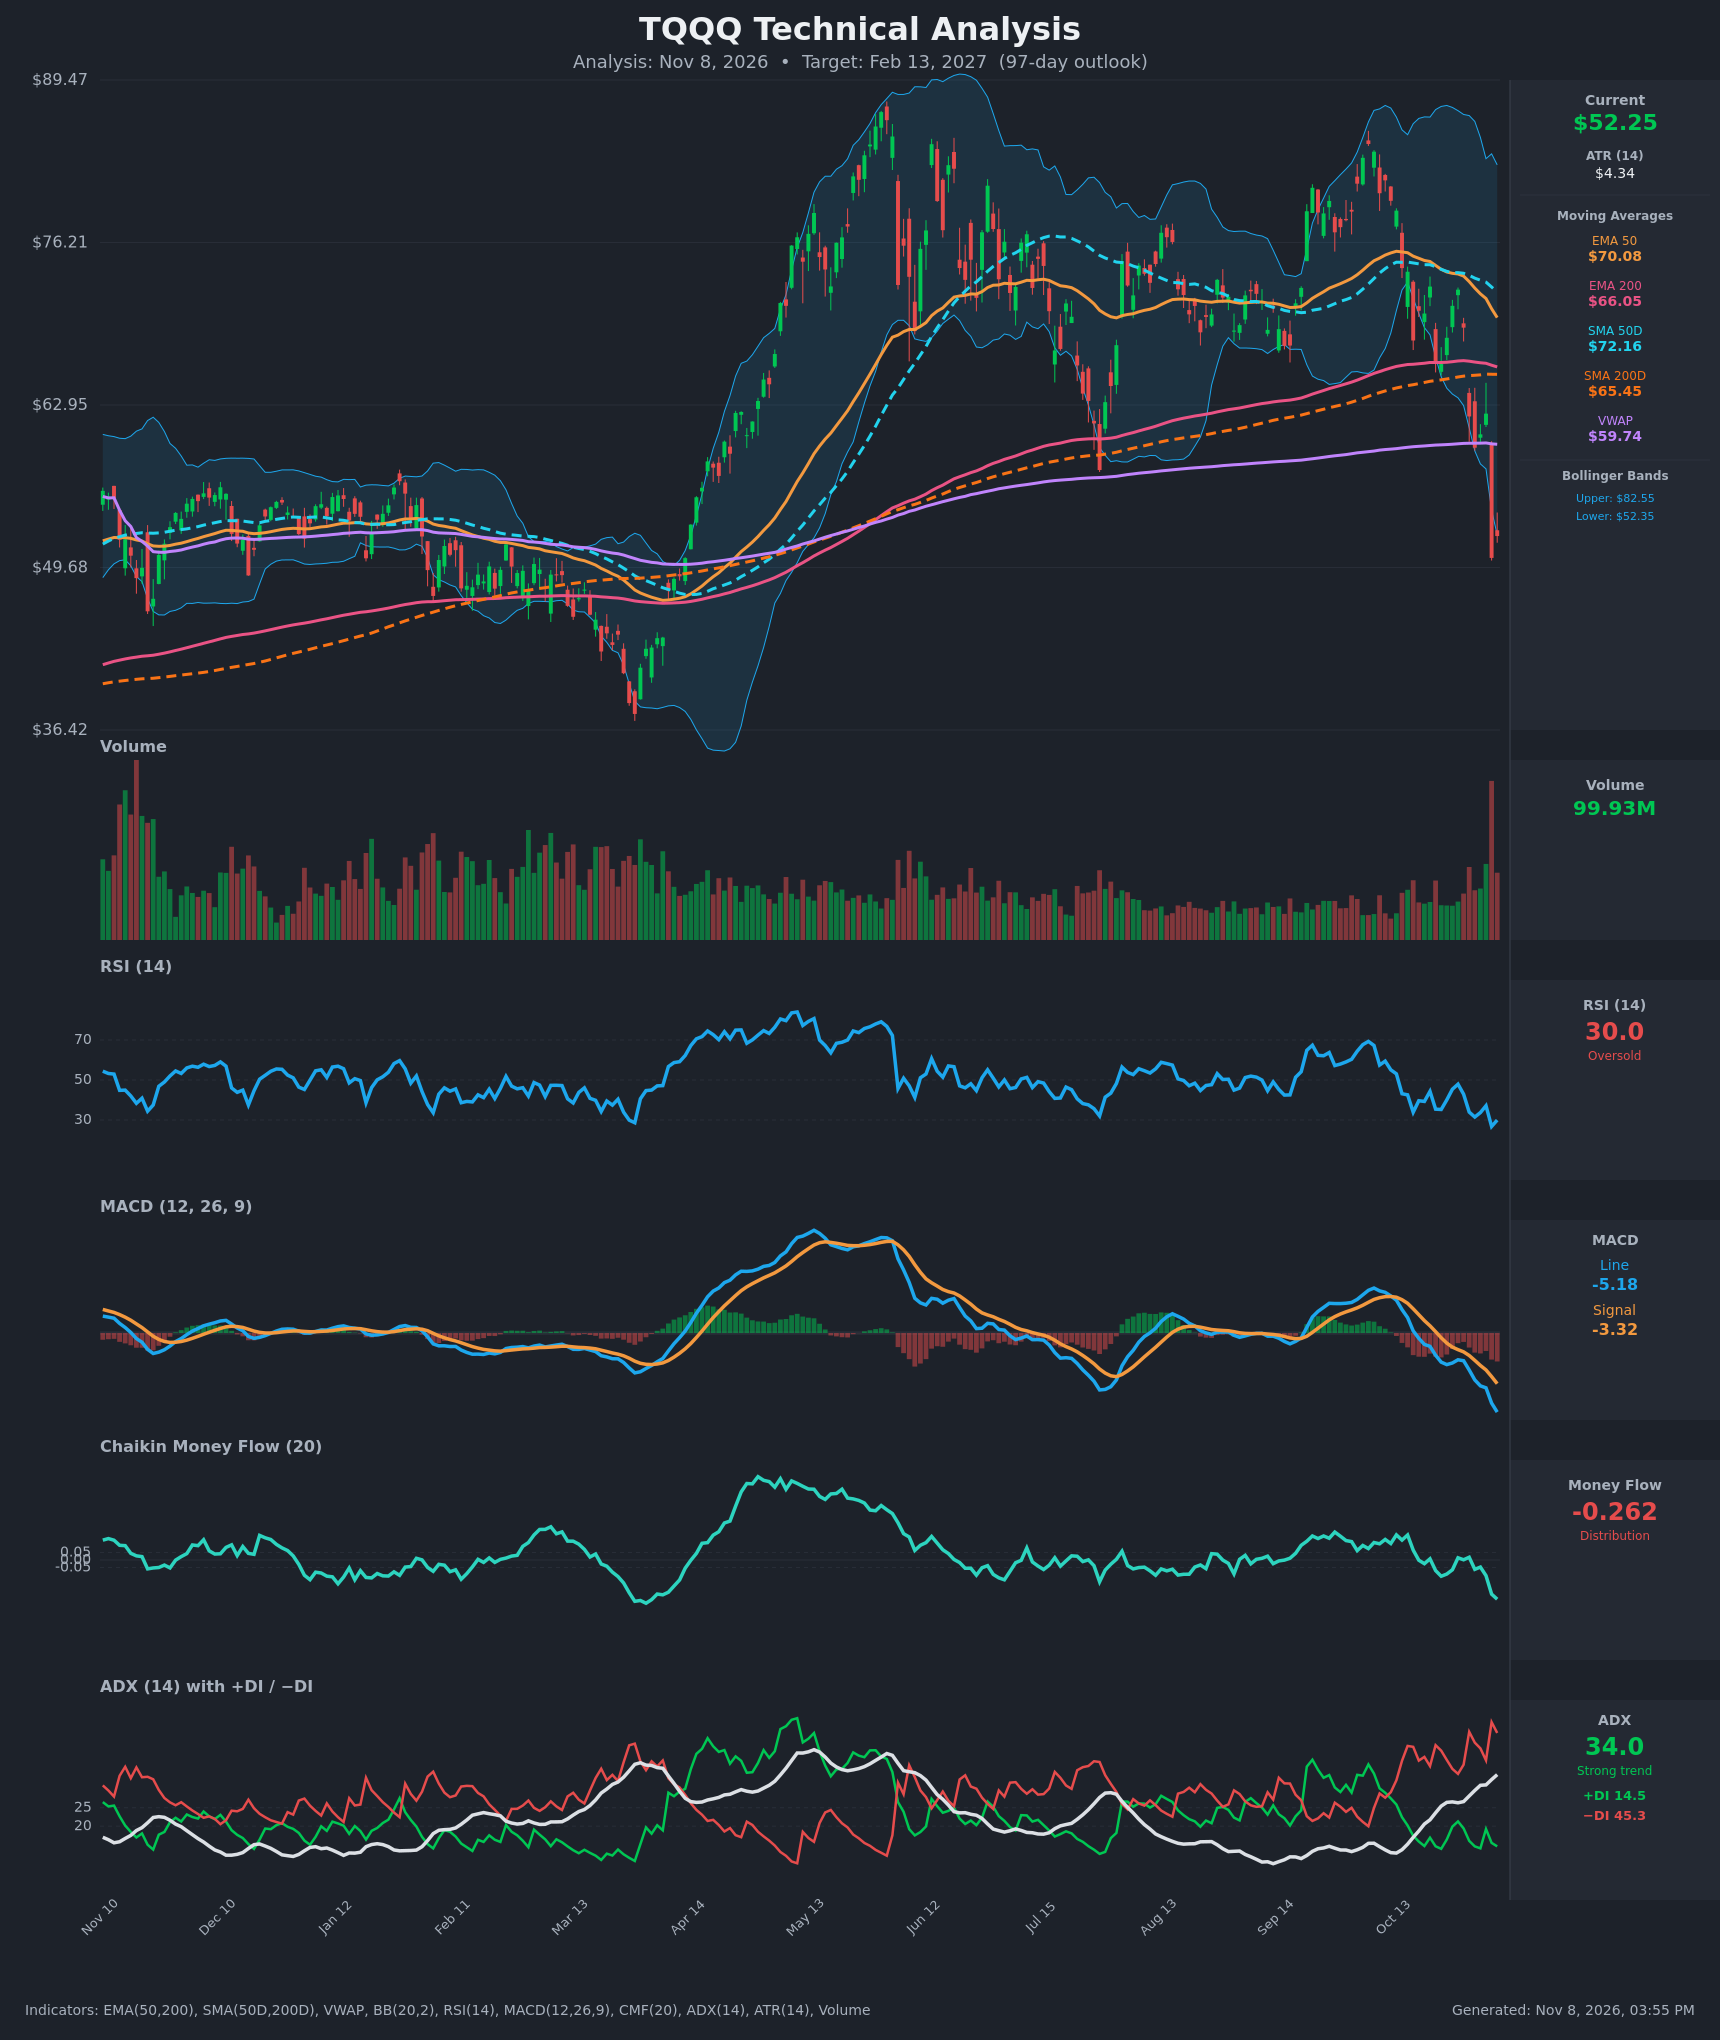
- RSI (14): 29.96, back at the oversold line after printing 26.8 on Nov 5. It has fallen from about 68 in early October. Momentum is still pointing down, but this is the most oversold reading since the March low. [Neutral]
- 20 EMA: The 20 EMA isn't supplied, so I'm using the EMA 50 at $70.08. Price at $52.25 is about 25% below it, and the EMA 50 is sloping down. It is still above the EMA 200 ($66.05) but narrowing, and price is far below both, so they act as heavy overhead resistance. [Bearish]
- MACD: Line -5.18 is below the signal at -3.32. The bearish crossover happened around Oct 22-23, and the negative histogram is widening (the gap is now about -1.9). The line is at its lowest level on the chart apart from the March trough. Momentum is bearish and not yet turning. [Bearish]
- Bollinger Bands (20): Price at $52.25 is hugging the lower band ($52.35), with the upper band at $82.55. The bands are very wide, which reflects the volatility of a 3x ETF. A close at or below the lower band after a gap-down shows an extended move, which tends to favor a relief bounce, but "walking the band" is possible in a strong trend. [Neutral]
- CMF (20): -0.262, well below -0.05 and the lowest reading of the past year apart from the March low. It has declined steadily from near 0 on Oct 30, so there is heavy distribution. [Distribution]
- ADX (14): 34.0 and rising from 18.7 two weeks ago, so a strong trend is established. −DI at 45.3 is far above +DI at 14.5, so bears are in firm control. High ADX with −DI this stretched often comes near the late stage of a selloff. [Strong Trend – Bearish]
- Volume: 99.93M, with the Nov 5 gap-down bar (-19%) on the heaviest volume of the chart. This looks like a selling climax or capitulation. It confirms the breakdown, and it is also the kind of spike that often marks an exhaustion low or at least a tradable bounce. [Climactic selling – Bearish near term, potential exhaustion]
DIVERGENCES & TRENDS
- There is no bullish RSI or MACD divergence. Both are making new lows with price, so momentum confirms the decline.
- The Nov 5 drop (-$11.77, about -19%) took price through the EMA 200 ($66.05), SMA 200D ($65.45) and VWAP ($59.74) in two weeks, a clean break of every long-term support. Price is now about 20% below the SMA 200D.
- Death cross status: the SMA 50D ($72.16) is still above the SMA 200D ($65.45), and the EMA 50 ($70.08) is still above the EMA 200 ($66.05). Both gaps are closing quickly, and a death cross is plausible within weeks.
- The MACD bearish crossover came on about Oct 22-23. The DI crossover (−DI over +DI) has been in place since early October.
- The RSI has made lower highs since the early-October peak near 68.
- CMF and ADX are both deteriorating together, which shows broad participation in the selling.
CHART PATTERNS
- Double-top-like structure (Bearish Double Top): There were two peaks in the high $80s, in May and in Sept-Oct. Price then broke below the July-October shelf (about $57-62). This is a bearish reversal structure, and the decline is consistent with it.
- Breakdown from a range (Bearish Rectangle / Triple Top style): Price ranged between roughly $62 and $76 from July to October. The measured move of the range height from the breakdown points to about $50-52, which is where price is now. This target has largely been met.
- Retest dynamics: Broken support at $57-62, which includes the VWAP at $59.74, typically gets retested from below after a climactic drop. That suggests a corrective bounce into the high $50s before the trend decides its next direction.
- Support zone: The $49.68 level matches the Nov-Mar consolidation base. A break below it opens a path to the March low near $37.
POTENTIAL SCENARIOS
- Scenario 1: Bullish Relief Bounce and Neckline Retest — The capitulation volume, RSI at 30 and price on the lower Bollinger Band lead to mean reversion. Price stabilizes above $49.70 and rallies toward the broken support and VWAP area, then stalls under the falling EMA 50. Trigger: a daily close above about $56 with RSI back above 40 and MACD histogram shrinking. Target: $56.50 by day 97, with an extension to $59.74 (VWAP). Invalidation: a daily close below $49.70. (42% probability)
- Scenario 2: Bearish Trend Continuation — The strong ADX, −DI dominance, distribution on CMF and the double-top breakdown keep price falling. A death cross follows, and rallies fail at the VWAP or the EMA 50. Trigger: a close below $49.70 on rising volume. Target: $44-$46, with a possible retest of the March low area near $37-40 in a deeper selloff. Invalidation: a close above $60 (VWAP). (38% probability)
- Scenario 3: Neutral Basing Range — After the shock, price builds a base between about $49 and $58 for several weeks, with indicators resetting from oversold. Trigger: low-volume chop with ADX rolling over. Target: about $52-$55. Invalidation: a close outside $49-$60. (20% probability)
PRICE TARGETS
- Target Price: $56.50 (97-day horizon)
- Expected Range: $47.00 to $61.50 (width $14.50, about 27.8% of the current price, in line with the 61-180 day guidance of 18-30%)
- Key Levels: Support at $49.70, Resistance at $59.74
OVERALL BIAS
OVERALL BIAS: BULLISH - This is a modest-conviction call for a relief bounce, not a trend reversal. The record-volume capitulation bar, RSI at 30 and price on the lower Bollinger Band favor a mean-reversion rally toward the broken $57-60 zone over 97 days. The trend evidence (MACD, ADX/−DI, CMF, price below all moving averages) is still firmly bearish, so a loss of $49.70 would invalidate the bounce and open a move toward the low $40s.
This is educational analysis and not financial advice.