WMT 97-day bullish forecast — Nov 8, 2026
- Bias: Bullish
- Timeframe: 97 days (made Nov 8, 2026, target date Feb 12, 2027)
- Price at analysis: $125.52
- Price target: $131.00
- Expected range: $113.00 – $140.50
- Result: Pending — graded after the close on Feb 12, 2027
Get a free AI analysis of WMT today
Analysis
TECHNICAL INDICATORS
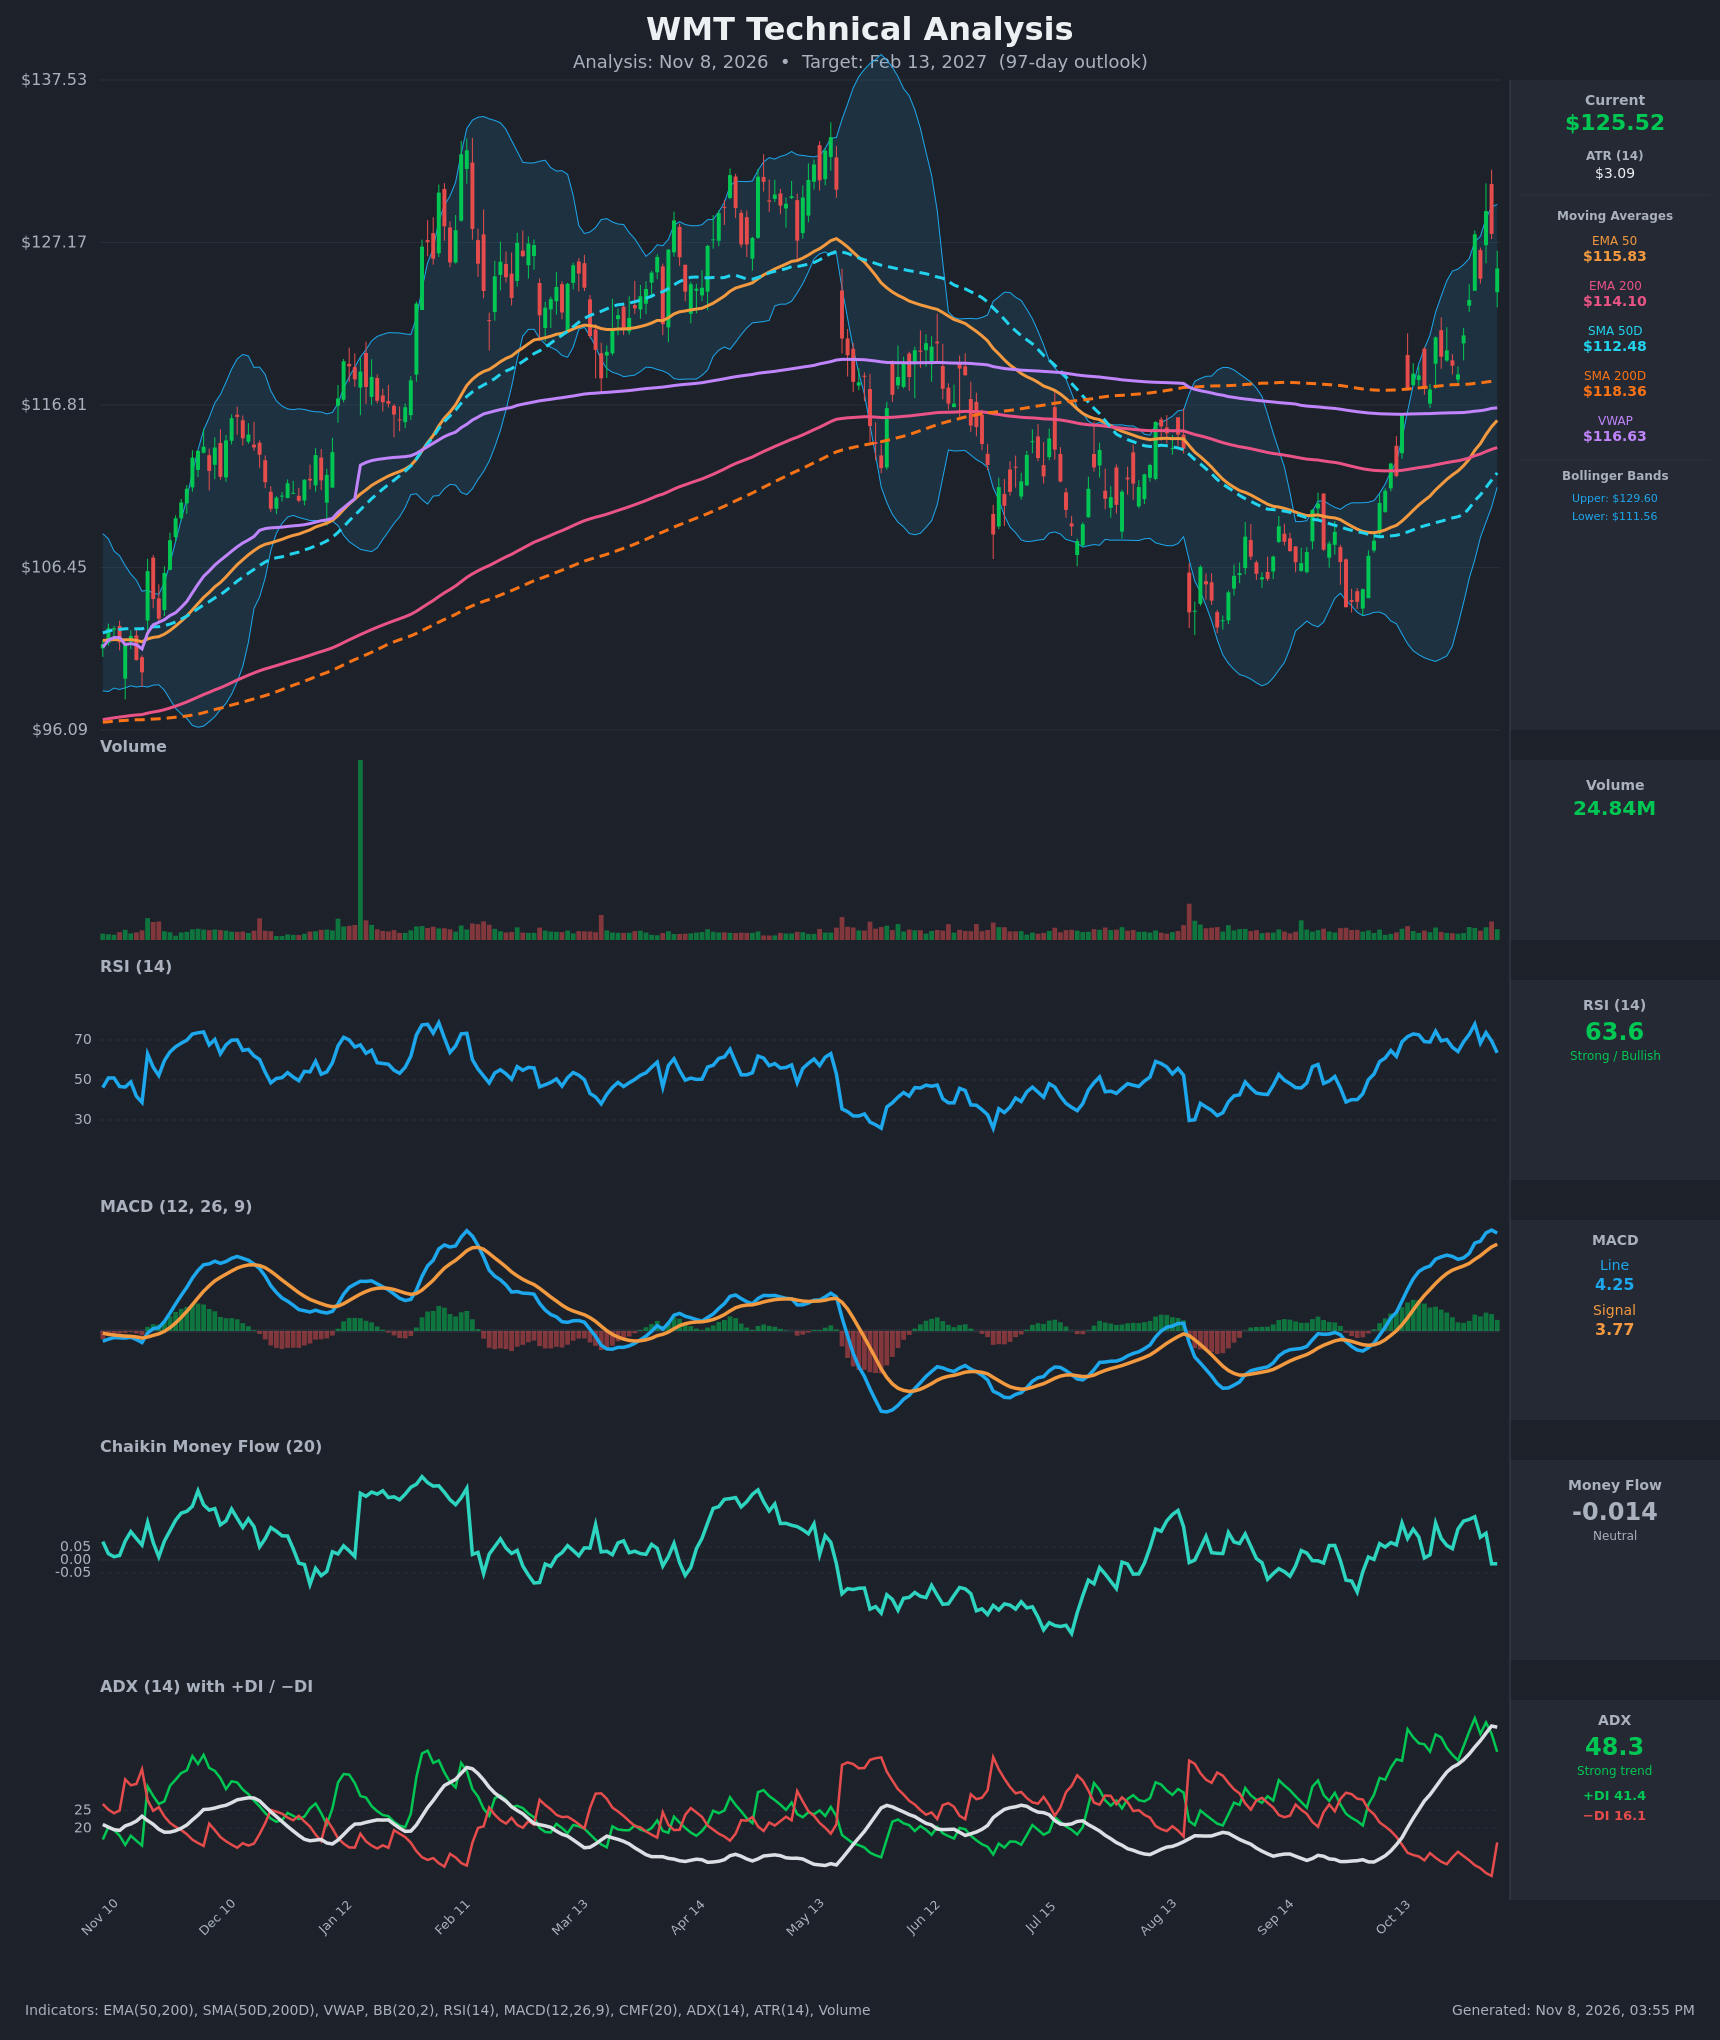
- RSI (14): 63.6, down from 77.9 on Nov 2 and 73.7 on Nov 4. The lower highs in RSI show momentum cooling after an overbought spell, but it holds well above 50 and is no longer overbought. [Bullish]
- 20 EMA: Not supplied. The last 15 closes imply it is roughly $121-122, so price at $125.52 is about 3% above it. The 20 EMA acts as first dynamic support, and the stretch above it makes a pullback toward it plausible. EMA50 ($115.83) and EMA200 ($114.10) sit well below and are rising. [Bullish]
- MACD: Line 4.251 is above signal 3.770, with a positive histogram of about +0.48. The histogram is shrinking (about +0.73 on Nov 5) and the line ticked down from 4.382. This is a bullish structure with early momentum fatigue. [Bullish]
- Bollinger Bands (20): Upper $129.60, lower $111.56, so the midline is about $120.6. Price at $125.52 is in the upper third of the bands after tagging the upper band on Nov 4 ($129.17). The bands are wide and expanding, which is typical of a strong trend. Walking the upper band is bullish, though a pullback to the midline is common. [Bullish]
- CMF (20): -0.014, inside the neutral zone. It slipped from +0.168 on Nov 2 and flipped negative on the last two bars. Volume is not confirming the breakout, which is a mild warning. [Neutral]
- ADX (14): 48.3 with +DI 41.4 over −DI 16.1. This is a very strong, rising trend with bulls firmly in control. ADX above 45 often marks a mature trend, so exhaustion or consolidation risk rises. +DI has fallen from 50.8 and −DI has jumped from 6.7 to 16.1 in the last session. [Strong Trend – Bullish]
- Volume: 24.84M, in line with the recent average. There was a modest uptick on the breakout days, with no climactic spike. The Nov 6 decline came on average volume, so there is no heavy distribution yet. [Neutral to mildly Bullish]
DIVERGENCES & TRENDS
- Mild bearish divergence: Price made a higher high at $129.17 (Nov 4) versus $127.69 (Nov 2). RSI printed 73.7 versus 77.9, a lower high. CMF is also drifting lower while price holds near highs. Both point to short-term momentum fatigue rather than a trend reversal.
- EMA crossover: EMA50 crossed above EMA200 around Nov 2 ($113.92 vs $113.58). This is a bullish crossover, and the gap is widening.
- SMA crossover: SMA50D ($112.48) is still below SMA200D ($118.36), but the gap has narrowed from about $8.9 to $5.9 in two weeks. A golden cross is likely within the next few weeks.
- Price vs. long-term averages: Price is above SMA200D ($118.36), EMA200, VWAP ($116.63) and all other averages. This confirms a long-term trend change from the Aug-Sep low near $101-103.
- MACD and DI: There is no bearish crossover. MACD remains above signal, though the spread is narrowing. +DI is far above −DI. The −DI uptick on Nov 6 is the first sign of selling interest.
- Sharp trend shift: ADX rose from about 18 in September to 48. A decline in ADX from 45-50 is often followed by consolidation.
CHART PATTERNS
- Broad base and breakout (reversal): The Aug-Sep low near $101-103 was followed by a rally through the 200-day average and the $118-120 zone. This resembles a bullish reversal base. It is not a textbook double bottom or inverted head and shoulders, but the effect is the same: a break above the prior consolidation.
- Possible Bullish Flag/Pennant (continuation): After the near-vertical rally to $129, a shallow pullback or tight consolidation in the $121-129 zone would fit a flag or pennant. A breakout above about $129.60-131 would project toward $135-140, a partial measured move.
- Overhead resistance: The prior swing highs near $131-133 (May peak) are the major resistance cluster. A failure there would create a double-top-like risk (Bearish Double Top in the reference diagram), but this is not yet confirmed.
POTENTIAL SCENARIOS
- Scenario 1: Bullish Trend Continuation / Flag Breakout — Price consolidates briefly above the 20 EMA/BB midline zone ($120-122), then resumes the uptrend as ADX stays elevated and the SMA golden cross confirms. Trigger: close above $129.60 (upper Bollinger/recent high) followed by $131. Target: $133-138, with a base-case 97-day target near $131. Invalidation: daily close below $118.40 (SMA200D). (50% probability)
- Scenario 2: Neutral Consolidation / Pullback and Range — Overextension and negative CMF drive a retracement to the $116-121 area (EMA50, VWAP and BB midline), followed by choppy trade below the prior highs. Trigger: failure at $129-130 and RSI sliding below 50. Target: $116-126 range. Invalidation: sustained break above $131. (30% probability)
- Scenario 3: Bearish Failed Breakout — A lower high near $129-133 forms a double-top-style reversal, with distribution (CMF below -0.05) and a MACD bearish crossover. Trigger: close below $118.40 and then $115.80. Target: $108-112 (retest of the SMA50D and the lower Bollinger Band area). Invalidation: reclaim of $127. (20% probability)
PRICE TARGETS
Timeframe: 97 days (to about Feb 13, 2027). The range width is $27.50, which is about 21.9% of the current price and sits inside the 18-30% guidance for 61-180 days.
- Target Price: $131.00 (97-day)
- Expected Range: $113.00 to $140.50
- Key Levels: Support at $118.40 (SMA200D, with the EMA50 at $115.83 below it), Resistance at $129.60 (upper Bollinger Band and recent highs; the next major resistance is around $133)
OVERALL BIAS
OVERALL BIAS: BULLISH - The trend is strong and bulls are in control (ADX 48.3 with +DI 41.4 vs −DI 16.1). Price is above every major moving average, MACD is above signal, and the EMA golden cross is in place with an SMA golden cross close. Near-term pullback risk is real given the RSI and CMF fade, but the evidence favors a higher price over 97 days.
This is educational analysis and not financial advice.