XLE 97-day bearish forecast — Nov 8, 2026
- Bias: Bearish
- Timeframe: 97 days (made Nov 8, 2026, target date Feb 12, 2027)
- Price at analysis: $61.62
- Price target: $59.00
- Expected range: $52.00 – $67.00
- Result: Pending — graded after the close on Feb 12, 2027
Get a free AI analysis of XLE today
Analysis
TECHNICAL INDICATORS
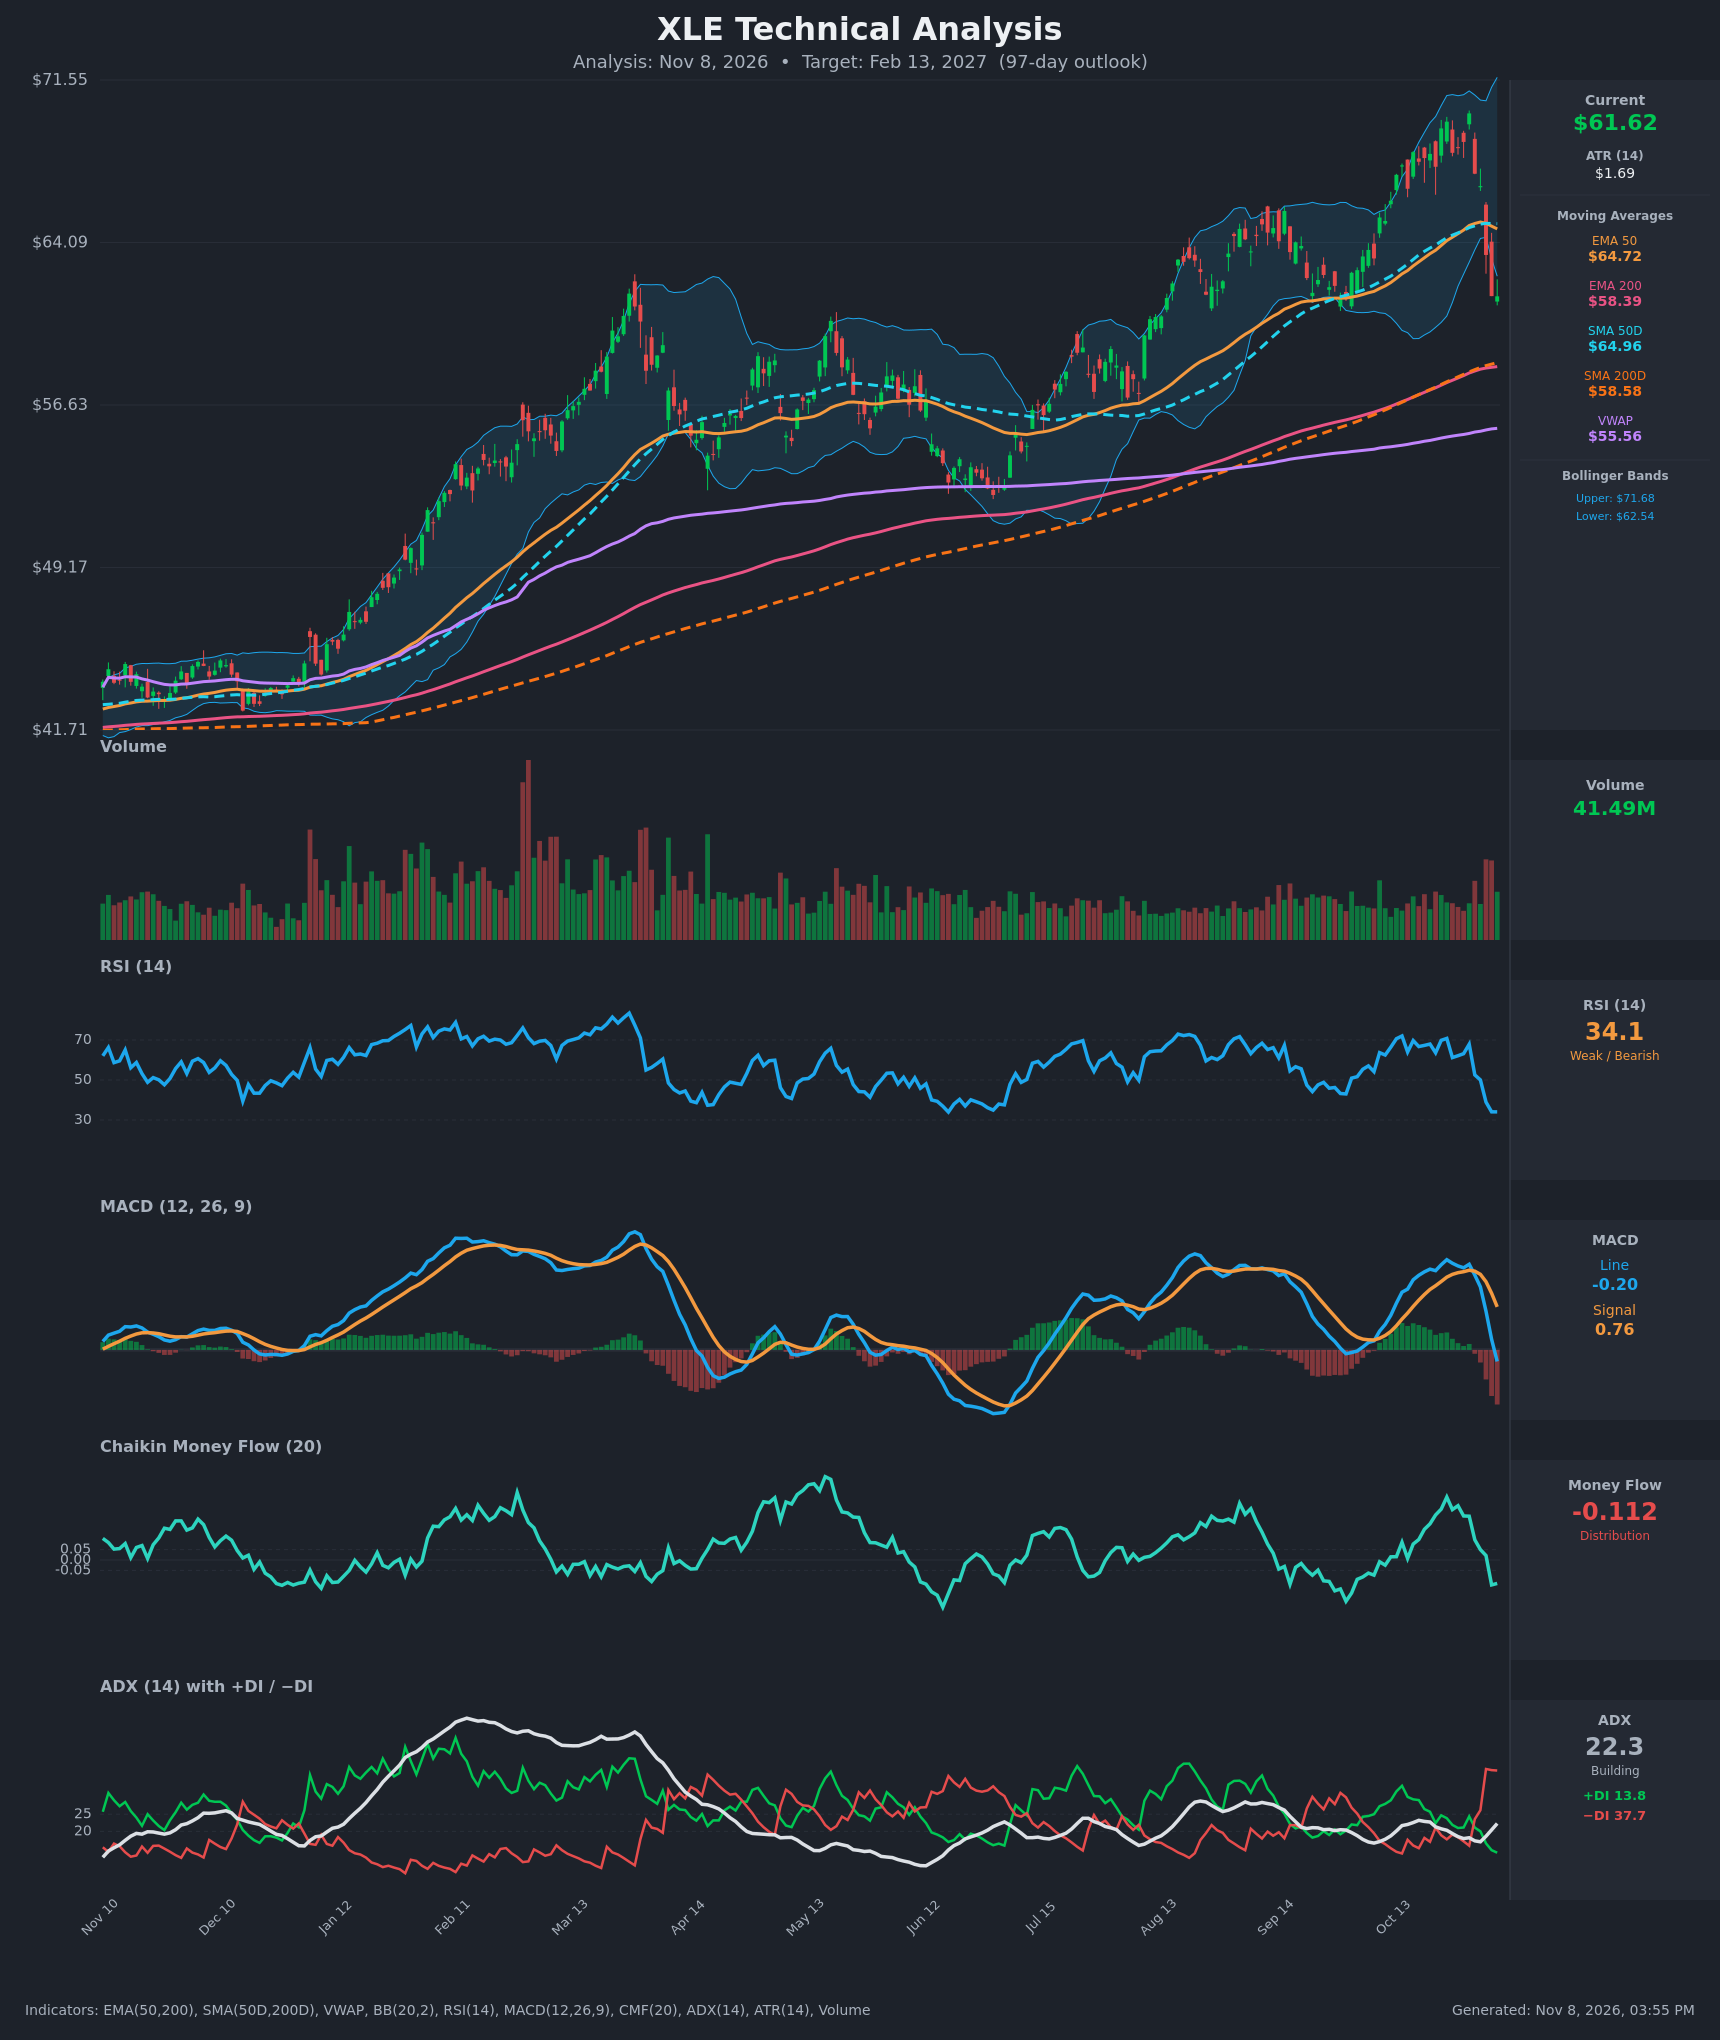
- RSI (14): 34.06, down from ~70 on Oct 26 and 67.9 on Oct 30. It is approaching oversold (<30) but not there yet. Momentum is clearly falling, and the flat last two readings (34.1, 34.1) hint at early stabilization. [Bearish]
- 20 EMA: The 20 EMA is not given, but the chart shows price well below the 20-period average, which is rolling over. Price is also below the EMA 50 ($64.72) and SMA 50 ($64.96), both of which are now overhead resistance. Price is still above the EMA 200 ($58.39) and SMA 200 ($58.58), which is the main support zone. [Bearish]
- MACD: The line (-0.203) crossed below the signal (0.758) on Nov 6 and went negative. It fell from +1.59 on Oct 26 to -0.20, and the histogram is deeply negative and expanding. This is a fresh bearish crossover. [Bearish]
- Bollinger Bands (20): Price at $61.62 is just below the lower band ($62.54) after the sharp drop from the upper band area (~$71.68). The band is wide, so volatility is expanded. A close outside the lower band signals strong selling pressure and is also a stretched, mean-reversion-prone reading. [Bearish]
- CMF (20): -0.112, which is distribution. It fell from +0.30 on Oct 26 to -0.119 within a week. This is a rapid swing from accumulation to selling pressure. [Distribution]
- ADX (14): 22.3 and rising from 17.0, so a trend is building. −DI (37.7) is far above +DI (13.8), meaning bears are firmly in control. The −DI/+DI spread is very wide, and the DI crossover to bearish occurred on Nov 2. [Weak-to-Building Trend, Bearish direction]
- Volume: 41.49M, elevated versus the recent baseline, with heavy red bars on the latest drop. Heavy volume on the decline suggests genuine distribution rather than a low-volume pullback. [Bearish confirmation]
DIVERGENCES & TRENDS
- Divergences: There is no bullish divergence yet. RSI is making lower lows with price, and MACD crossed down. The earlier peak around $70 had the RSI at only ~68-71, so momentum did not confirm a decisive breakout.
- Trends: The long-term trend remains up. EMA 200 and SMA 200 are rising, price is above both, and the EMA 50 has been above the EMA 200 for months, so there is no death cross. The intermediate trend has turned down: price lost both 50-period averages in one week (the Nov 4 and Nov 5 drops of -$3.2 and -$1.9).
- Crossovers and breaks:
- MACD bearish cross on Nov 6.
- −DI crossed above +DI on Nov 2.
- Price broke below the 50s and the lower Bollinger band.
- CMF dropped below -0.05.
- VWAP ($55.56) sits well below, and price is above it, so the long-term buying base is intact.
- The EMA 50 and SMA 50 are flattening or rolling over.
CHART PATTERNS
- Bearish Double/Triple Top: The ~$69-70 highs (Oct 23, Oct 26, Oct 30) form a rounded multi-peak top with the neckline near $66-67. That neckline was broken on Nov 3-4. The measured move from the ~$3.5 pattern height is already largely reached (~$63), so extension toward the $58-59 200-day cluster is plausible.
- Failed breakout: The spike to the upper Bollinger band at ~$70 reversed hard, which is a classic blow-off pattern.
- Larger structure: The chart shows a long-term ascending channel from $42 to $70 with a higher-low sequence ($53 → $52 → $61). The $58.4-58.6 zone is the natural next support, and a break below would damage the higher-low structure.
- Significance: The pattern is bearish near-term, but the large uptrend limits downside to the 200-period averages unless broken.
POTENTIAL SCENARIOS
- Scenario 1: Bearish Pullback to the 200-Day Zone — Price continues lower on the MACD and DI signals, retests the rising 200 EMA/SMA, and consolidates around $58-61 with only occasional bounces to the lower Bollinger band area. Trigger: failure to reclaim $62.54 and a close below $60.50. Target: $58.50-$59.50. Invalidation: daily close above $64.96 (SMA 50). (45% probability)
- Scenario 2: Bullish Oversold Rebound and Recovery — RSI nears 30 and price snaps back toward the 50-period averages as the long-term uptrend reasserts, with energy-sector buyers defending the pullback. Trigger: close above $64.96 with MACD turning back up. Target: $66.00-$68.00. Invalidation: close below $58.40. (35% probability)
- Scenario 3: Bearish Breakdown Below the 200-Day Averages — The rally is confirmed as a failed top. Price loses the 200-day cluster, a higher-low breaks, and a deeper correction follows toward the $52-55 area. Trigger: weekly close below $58.00 on heavy volume. Target: $53.00-$55.00. Invalidation: reclaim of $61.50 after the breakdown. (20% probability)
PRICE TARGETS
- Target Price: $59.00 (97-day horizon; a drift toward the rising 200-day averages)
- Expected Range: $52.00 to $67.00 (width $15.00 = ~24.3% of the current price, consistent with the 61-180 day guidance of ~18-30%)
- Key Levels: Support at $58.40 (EMA 200/SMA 200 zone), Resistance at $64.72 (EMA 50, with SMA 50 at $64.96 just above)
OVERALL BIAS
OVERALL BIAS: BEARISH - MACD crossed bearish, −DI (37.7) dominates +DI (13.8), CMF is in distribution at -0.112, and price lost both 50-period averages on heavy volume after a failed run at $70. The long-term uptrend and the rising 200-day averages near $58.4-58.6 should limit the decline, so the target is a pullback toward that zone rather than a collapse.
This is educational analysis and not financial advice.