QQQ 4-day bullish forecast — Nov 10, 2026
- Bias: Bullish
- Timeframe: 4 days (made Nov 10, 2026, target date Nov 13, 2026)
- Price at analysis: $678.76
- Price target: $684.00
- Expected range: $666.00 – $693.00
- Result: Incorrect (-0.6%) — closed at $674.38 on Nov 13, 2026; quality score 50/100
Get a free AI analysis of QQQ today
Analysis
TECHNICAL INDICATORS
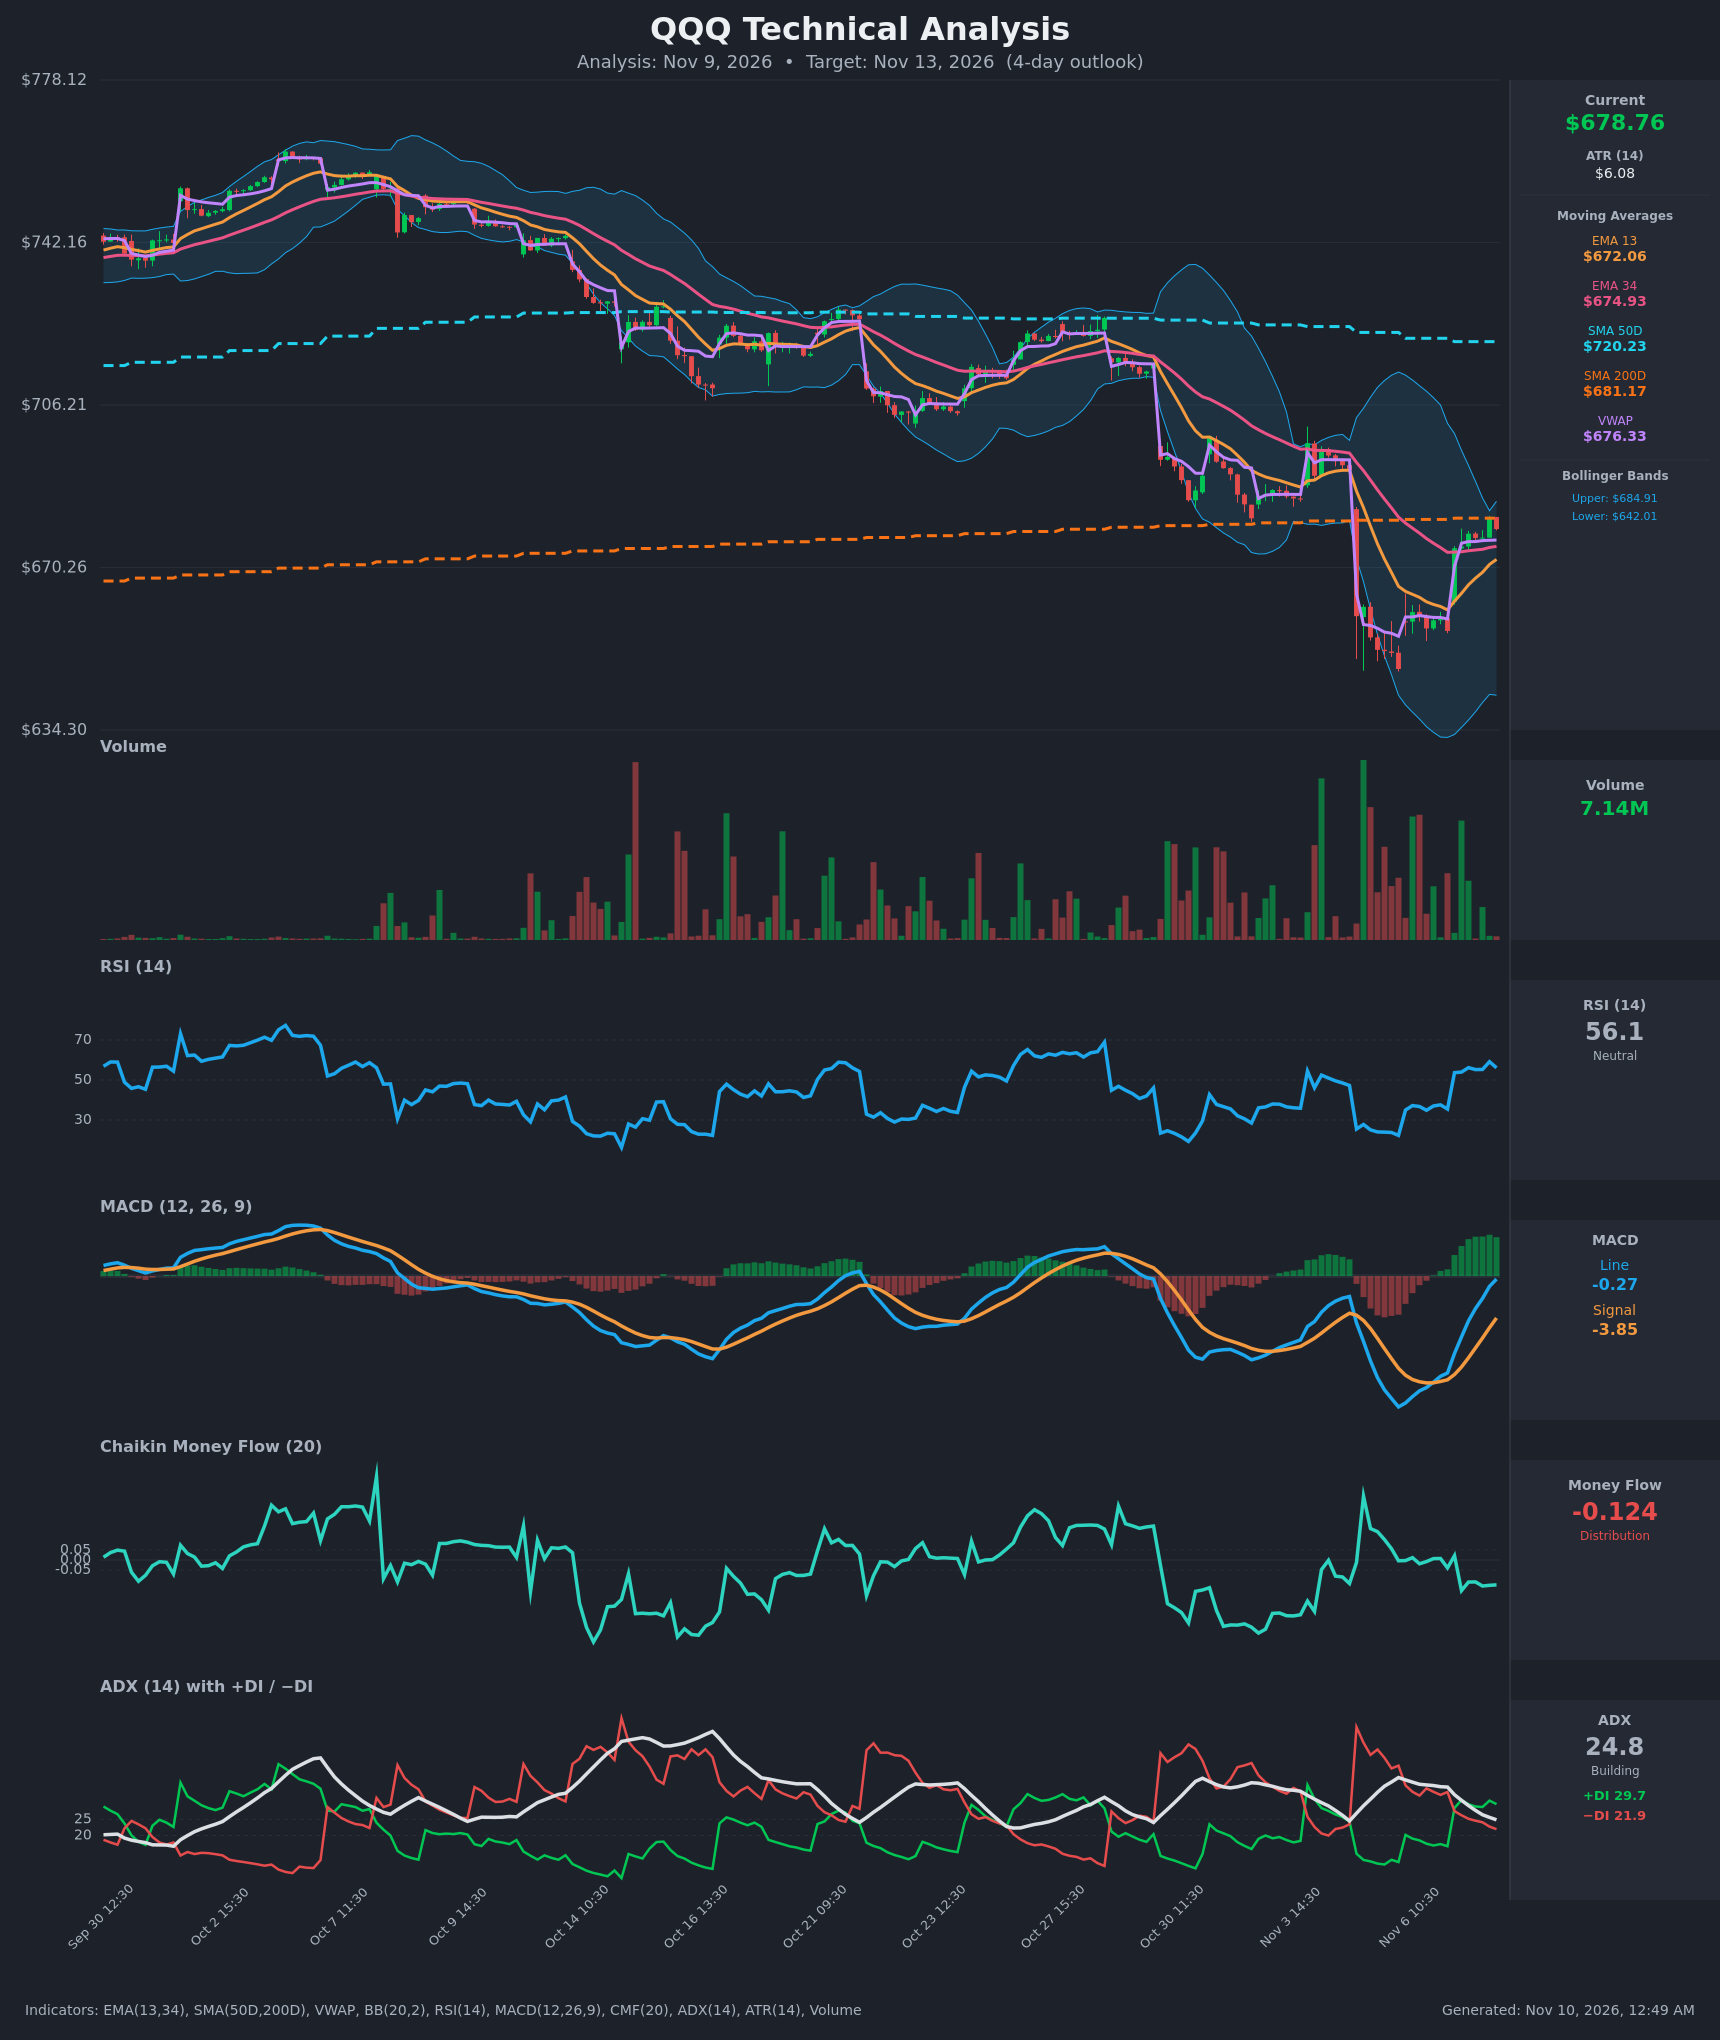
- RSI (14): 56.09, up from a deeply oversold 22.3 on Nov 5. It has held in the mid-50s for the past 7 bars, which points to a stabilized rebound. It is not overbought, so there is room to run. [Bullish]
- 20 EMA: Only EMA 13 ($672.06) and EMA 34 ($674.93) are provided. Price at $678.76 is above both, so they act as near-term support. EMA 13 is still below EMA 34, so there is no bullish crossover yet, but the gap has narrowed from about $15 to about $3. A cross within the 4-day window is plausible. [Bullish]
- MACD: Line -0.27 is above signal -3.86, so the bullish crossover happened on Nov 6 13:30. The histogram is positive (+3.6) and has expanded for 7 consecutive bars. The line is nearly at zero, and a move above zero would confirm the momentum shift. [Bullish]
- Bollinger Bands (20): Upper $684.91, lower $642.01, so the bands are wide after the selloff. Price is in the upper third of the bands, about $6 (roughly 1 ATR) below the upper band. The bands are starting to contract from the extreme expansion, and the recovery is walking toward the upper band. [Neutral]
- CMF (20): -0.124 is clearly in distribution territory (below -0.05) and has stayed negative on the rally. Price is rising while money flow is falling, which is a warning that the bounce lacks sponsorship. [Distribution]
- ADX (14): 24.8, near the 25 threshold but falling from 37.9. +DI (29.7) has crossed above −DI (21.9), so bulls have taken control, but the trend strength is fading as the prior downtrend exhausts. [Weak-to-Moderate Trend, Bullish direction]
- Volume: 7.14M on the latest bar, which is moderate. Volume was heavy on the capitulation days (Nov 3–6) and is lighter on the rebound. Buying is not showing strong conviction, though selling has also dried up. [Neutral / slightly Bearish]
Other reference levels:
- VWAP: $676.33, with price just above it, a mild buyer-control signal.
- SMA 200D: $681.17 sits just $2.40 overhead as immediate resistance.
- SMA 50D: $720.23 is far overhead and still declining.
DIVERGENCES & TRENDS
- Bearish divergence (money flow): Price rose from $647 to $679 while CMF fell from about 0 to -0.124. The rally is not confirmed by accumulation.
- Bullish momentum shift: RSI rose from 22 to 56. MACD crossed above its signal and the histogram has expanded for 7 bars. The DI lines crossed, with +DI above −DI.
- Fading downtrend: ADX fell from 37.9 to 24.8 as the −DI-driven trend lost force.
- Moving averages: EMA 13 is closing on EMA 34, and a bullish cross is near. Price is testing the SMA200 from below at $681.17, which is decisive overhead resistance. Price remains well below the declining-slope SMA50 ($720).
- Gap: The Nov 9 open gapped up from $656 to $674.5. Price has held and built above the gap, which is constructive. A gap fill would be the bearish tell.
CHART PATTERNS
- Primary read: A V-shaped capitulation low near $647 followed by a sharp rebound. The decline through early November broadly resembles the Bullish Falling Wedge / Bullish Expanding Triangle reversal structures in the reference diagram, since the lower lows came with expanding ranges and the bounce is now breaking out of the descending channel.
- Significance: Those reversal patterns target a retracement of the prior leg. The nearest checkpoints are the SMA200/upper-BB cluster at $681–685, then the October lows area near $700.
- Caveat: The rebound has not yet confirmed a higher low. The larger structure is still lower highs and lower lows, so a failure at $681–685 would turn this into a bearish-continuation bounce, similar to the diagram's Bearish Pennant or Flag.
POTENTIAL SCENARIOS
- Scenario 1: Bullish Break Through the SMA200 — Momentum (MACD, DI, RSI) carries price through the SMA200 and toward the upper Bollinger Band, with EMA 13 crossing above EMA 34. Trigger: a hourly close above $681.17 and then $685. Target: $684–$692. Invalidation: a close back below $672 (EMA 13) and the $674.5 gap area. (50% probability)
- Scenario 2: Bearish Rejection and Gap Fill — Price stalls at the SMA200 and upper BB, and CMF distribution pulls it back. Trigger: failure to hold above $681 and a break of VWAP ($676.33) and EMA 13. Target: $666–$672, with a possible gap fill toward $656–$660. Invalidation: a sustained close above $685. (35% probability)
- Scenario 3: Neutral Consolidation Under the SMA200 — Price chops between EMA 13 and the SMA200/upper BB while indicators reset. Trigger: low-volume range trading. Target: $673–$683. Invalidation: a close beyond either edge of the range. (15% probability)
PRICE TARGETS
Timeframe: 4 days (target date Nov 13, 2026).
- Target Price: $684.00
- Expected Range: $666.00 to $693.00. Width is $27, or about 4.0% of the current price, which fits the 2-4% guidance for a short horizon.
- Key Levels: Support at $672.06 (EMA 13), Resistance at $681.17 (SMA 200D). Further resistance is at the upper Bollinger Band, $684.91.
OVERALL BIAS
OVERALL BIAS: BULLISH - Momentum has turned up: MACD is above its signal with a rising histogram, +DI is above −DI, RSI has recovered to 56, and price is above both EMAs and VWAP. Conviction is modest because CMF shows distribution and the SMA200 at $681 is overhead resistance, so a rejection there is the main risk.
This is educational analysis and not financial advice.