IWM 31-day bullish forecast — Nov 12, 2026
- Bias: Bullish
- Timeframe: 31 days (made Nov 12, 2026, target date Dec 12, 2026)
- Price at analysis: $278.51
- Price target: $285.50
- Expected range: $266.00 – $302.00
- Result: Pending — graded after the close on Dec 12, 2026
Get a free AI analysis of IWM today
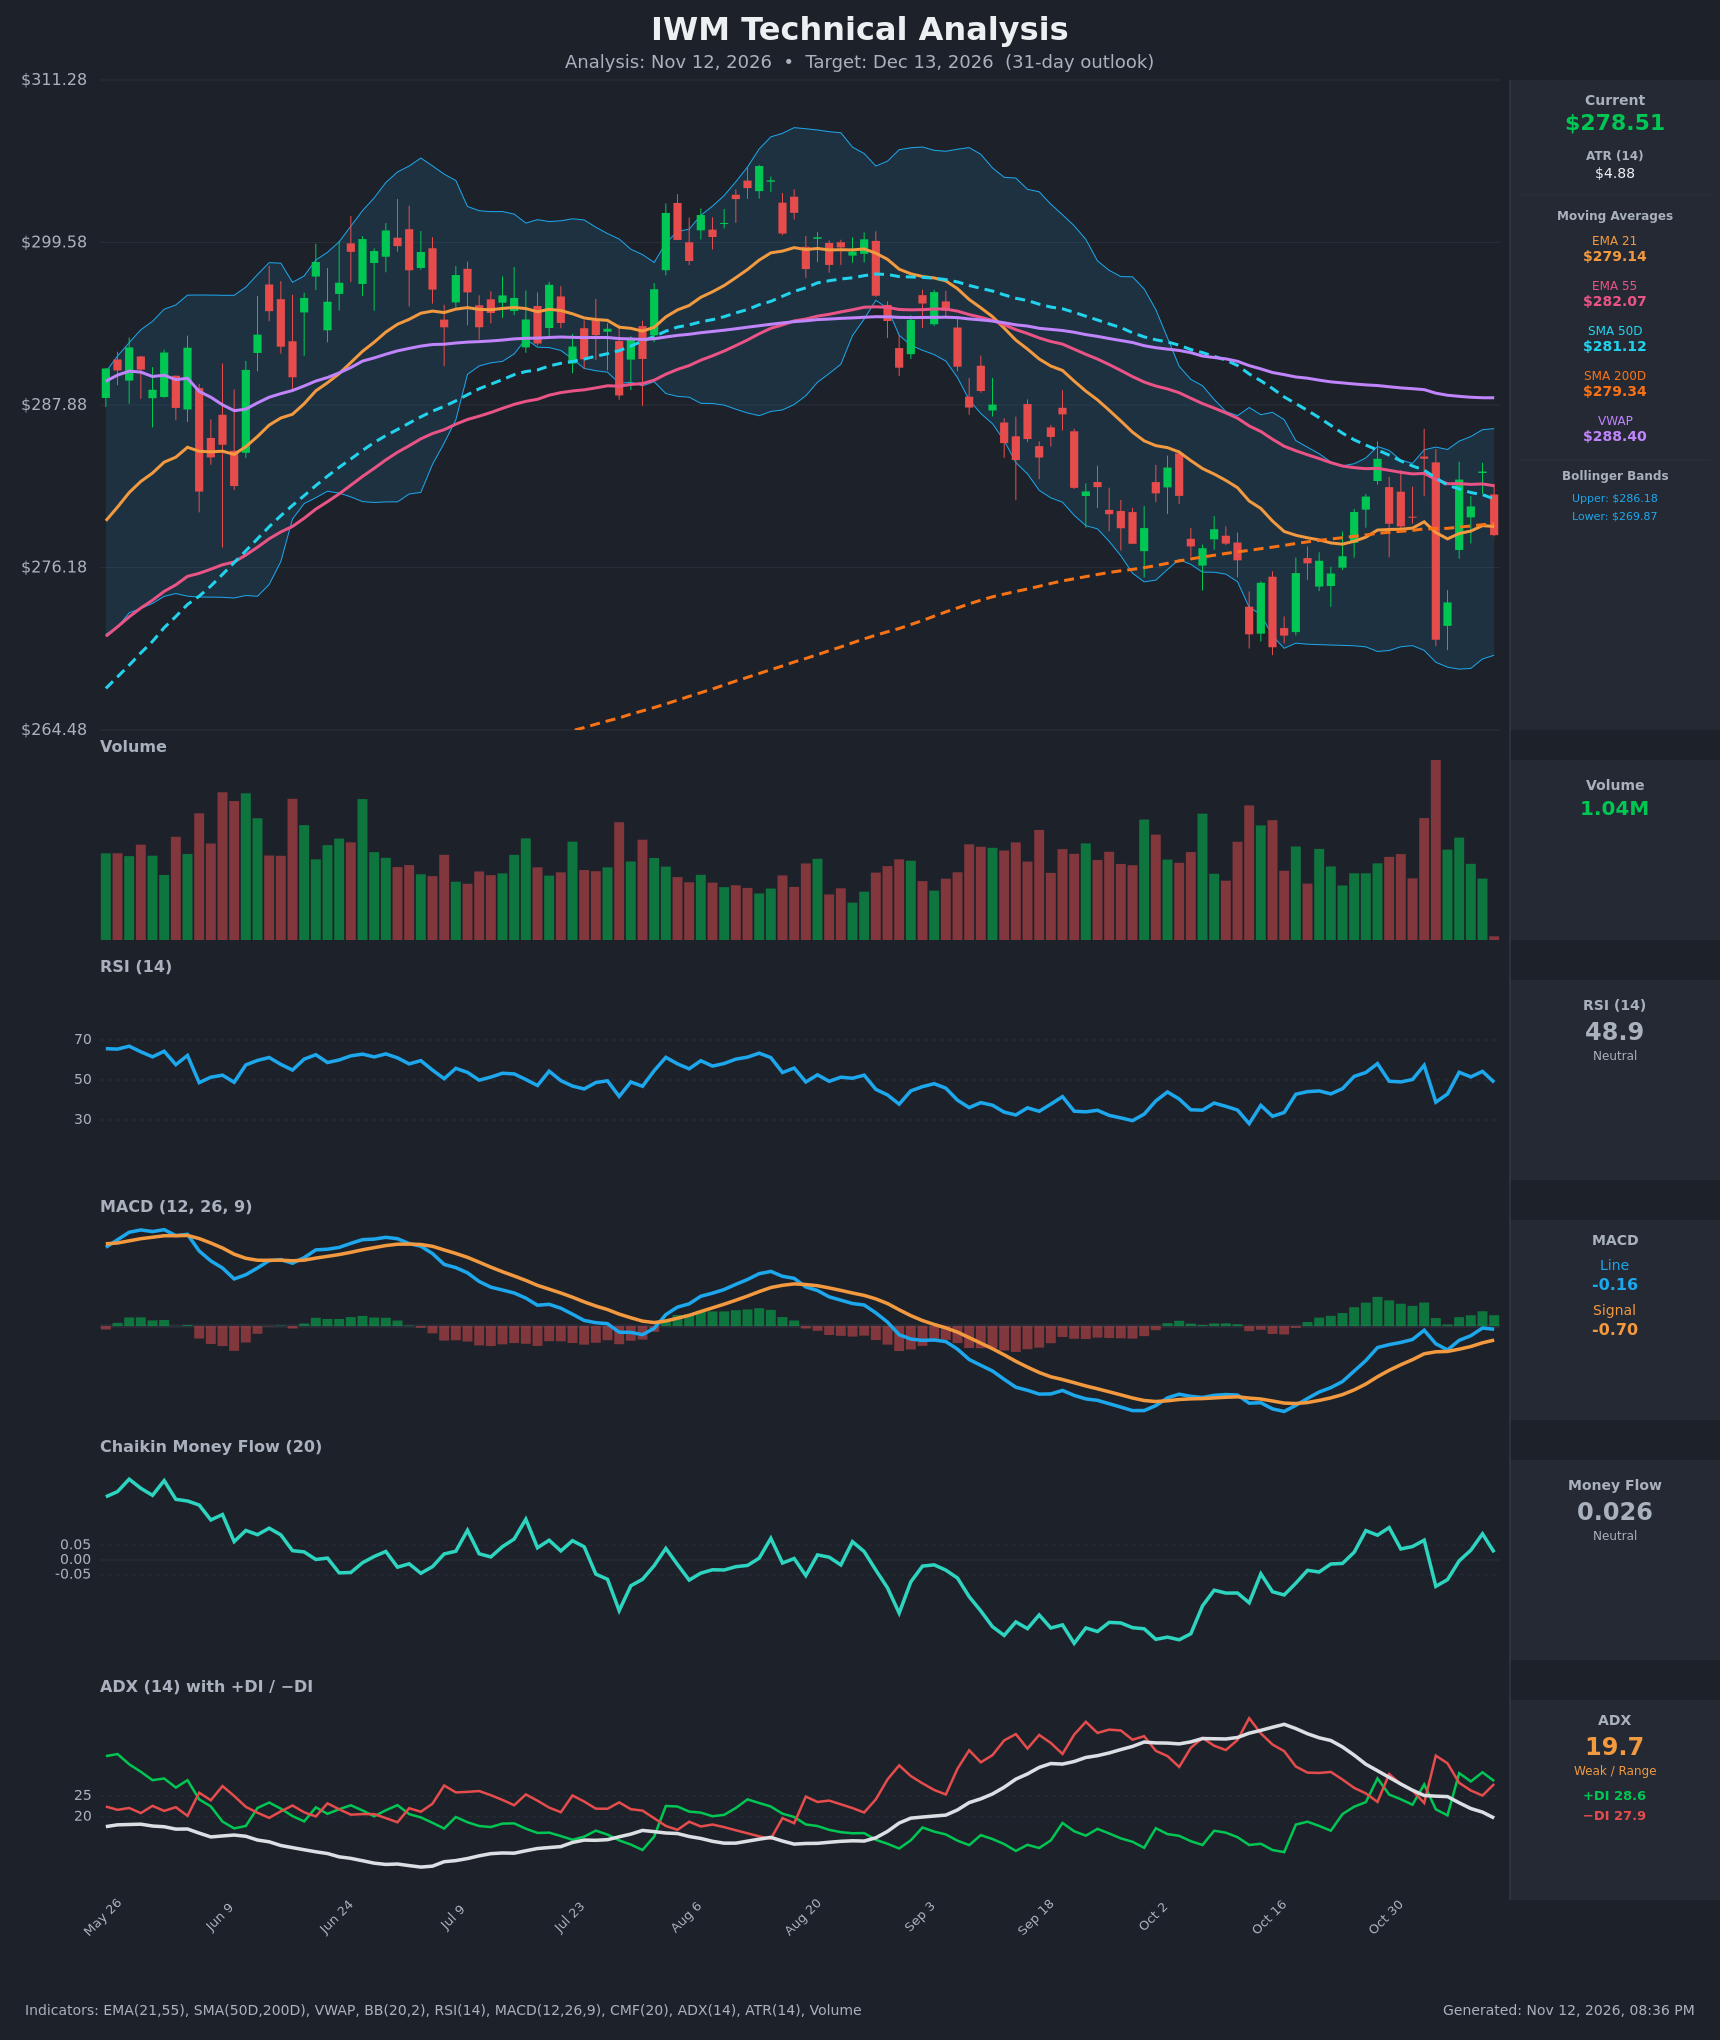
Analysis
TECHNICAL INDICATORS
- RSI (14): 48.87, right at the 50 midline. It has swung between 39 and 58 over the last two weeks without a trend, so momentum is balanced. [Neutral]
- 20 EMA: EMA 21 is $279.14 and price ($278.52) sits just below it. EMA 21 is flat to slightly rising and is meeting SMA200D ($279.34), so this zone is a pivot. EMA 55 ($282.07) and SMA50D ($281.12) sit above as overhead resistance. [Neutral]
- MACD: Line is -0.16 and signal is -0.70, so the line is above the signal and the histogram is positive (+0.54). The line has been rising steadily from about -3.1 and is nearly at the zero line. Momentum has recovered, though the line is still slightly below zero. [Bullish]
- Bollinger Bands (20): Upper $286.18, lower $269.87, midline about $278. Price is at the midline with moderately wide bands (about 5.9% width) after the Nov 5 volatility spike. The $270 lows have held at the lower band twice. [Neutral]
- CMF (20): 0.026, inside the neutral zone (±0.05). It has climbed from the deeply negative readings of Sep–Oct (distribution) and is mostly positive over the last 10 sessions. Selling pressure has faded but buying is not yet decisive. [Neutral]
- ADX (14): 19.7 and falling from 38, which signals a weak trend and range-bound conditions. +DI (28.6) is marginally above −DI (27.9), so neither side controls. The prior downtrend has lost its strength. [Weak Trend, no clear direction]
- Volume: 1.04M is average. The heavy-volume event was the Nov 5 sell-off (a long red candle to about $270), which was fully reversed within days, a sign of washout and absorption. Recent up days carry a bit more volume than down days. [Mildly constructive]
DIVERGENCES & TRENDS
- Bullish momentum divergence: Price made a similar low around $270–271 on Nov 5 as in mid-October, but MACD and RSI made much higher lows (RSI about 39 vs about 28 in October). MACD went from -3.6 to near zero, and CMF has risen from about -0.1 to positive.
- Trend fading: ADX has dropped from 38 to 19.7. The Aug–Oct downtrend is exhausted, but no new uptrend has been confirmed.
- Moving-average compression: SMA50D ($281.12) is falling toward SMA200D ($279.34). A death cross is possible if price weakens, though the gap is narrowing slowly and the signal would be late after an already-completed decline. EMA 21 is converging with the SMA200D, so this is a decision zone.
- MACD: The line crossed above its signal in late October and the histogram is positive. There is no new crossover, but the line is still below zero.
- Price vs VWAP: Price is about 3.4% below VWAP ($288.40), which is a major overhead supply zone.
- Price vs moving averages: Price is slightly below EMA 21, SMA200D, SMA50D and EMA 55. This is a reclaim-or-reject setup.
CHART PATTERNS
- Bullish Double Bottom (reversal): The mid-October low (about $270) and the Nov 5 low (about $270–271) form two equal lows. The neckline is at about $284–285, the Oct 29 and Nov 4 highs and the upper Bollinger Band. A confirmed close above $285 projects a measured move of about $14–15, to roughly $299–300. This matches the Sept–Oct congestion zone and the SMA50D from earlier in the year.
- Consolidation range: Price has held $270–$285 for about 5–6 weeks with ADX below 20. This is not yet a breakout, and the pattern is unconfirmed until the neckline breaks.
- Failure condition: A close below $270 would invalidate the double bottom and expose a deeper leg toward $262–265.
POTENTIAL SCENARIOS
- Scenario 1: Bullish Double-Bottom Breakout — Price reclaims the EMA 21/SMA200D pivot, pushes through the EMA 55/SMA50D cluster (about $281–282), and breaks the $285 neckline as MACD crosses above zero. Trigger: daily close above $285 with CMF above +0.05 and rising volume. Target: $293–$299, with a first stop at $288.40 (VWAP). Invalidation: daily close below $270. (45% probability)
- Scenario 2: Neutral Range Persistence — ADX stays weak and price chops between $270 and $285 around the MA cluster. Trigger: repeated rejections at $284–286 and buying at $272–275. Target: $274–$284. Invalidation: close outside $268–$287. (30% probability)
- Scenario 3: Bearish Breakdown / Death-Cross Risk — Price fails at EMA 55/SMA50D, loses the SMA200D, and the SMA50D crosses below the SMA200D, leading to a break of $270. Trigger: daily close below $270 with −DI above +DI and ADX rising above 25. Target: $260–$263. Invalidation: close above $285. (25% probability)
PRICE TARGETS
- Target Price: $285.50 (31 days, Dec 13, 2026)
- Expected Range: $266.00 to $302.00 (width $36.00, about 12.9% of current price, in line with the 12–18% guidance for 30–60 days)
- Key Levels: Support at $270.00, Resistance at $284.50
OVERALL BIAS
OVERALL BIAS: BULLISH - A potential double bottom at $270 is backed by strong momentum divergence (MACD near zero, positive histogram, RSI and CMF improving) and a fading downtrend (ADX falling). Conviction is modest: price is still below the key moving-average cluster and VWAP, so a close above $285 is needed to confirm.
This is educational analysis and not financial advice.