SPCX 6-day bearish forecast — Nov 15, 2026
- Bias: Bearish
- Timeframe: 6 days (made Nov 15, 2026, target date Nov 20, 2026)
- Price at analysis: $139.10
- Price target: $136.80
- Expected range: $134.50 – $143.50
- Result: Pending — graded after the close on Nov 20, 2026
Get a free AI analysis of SPCX today
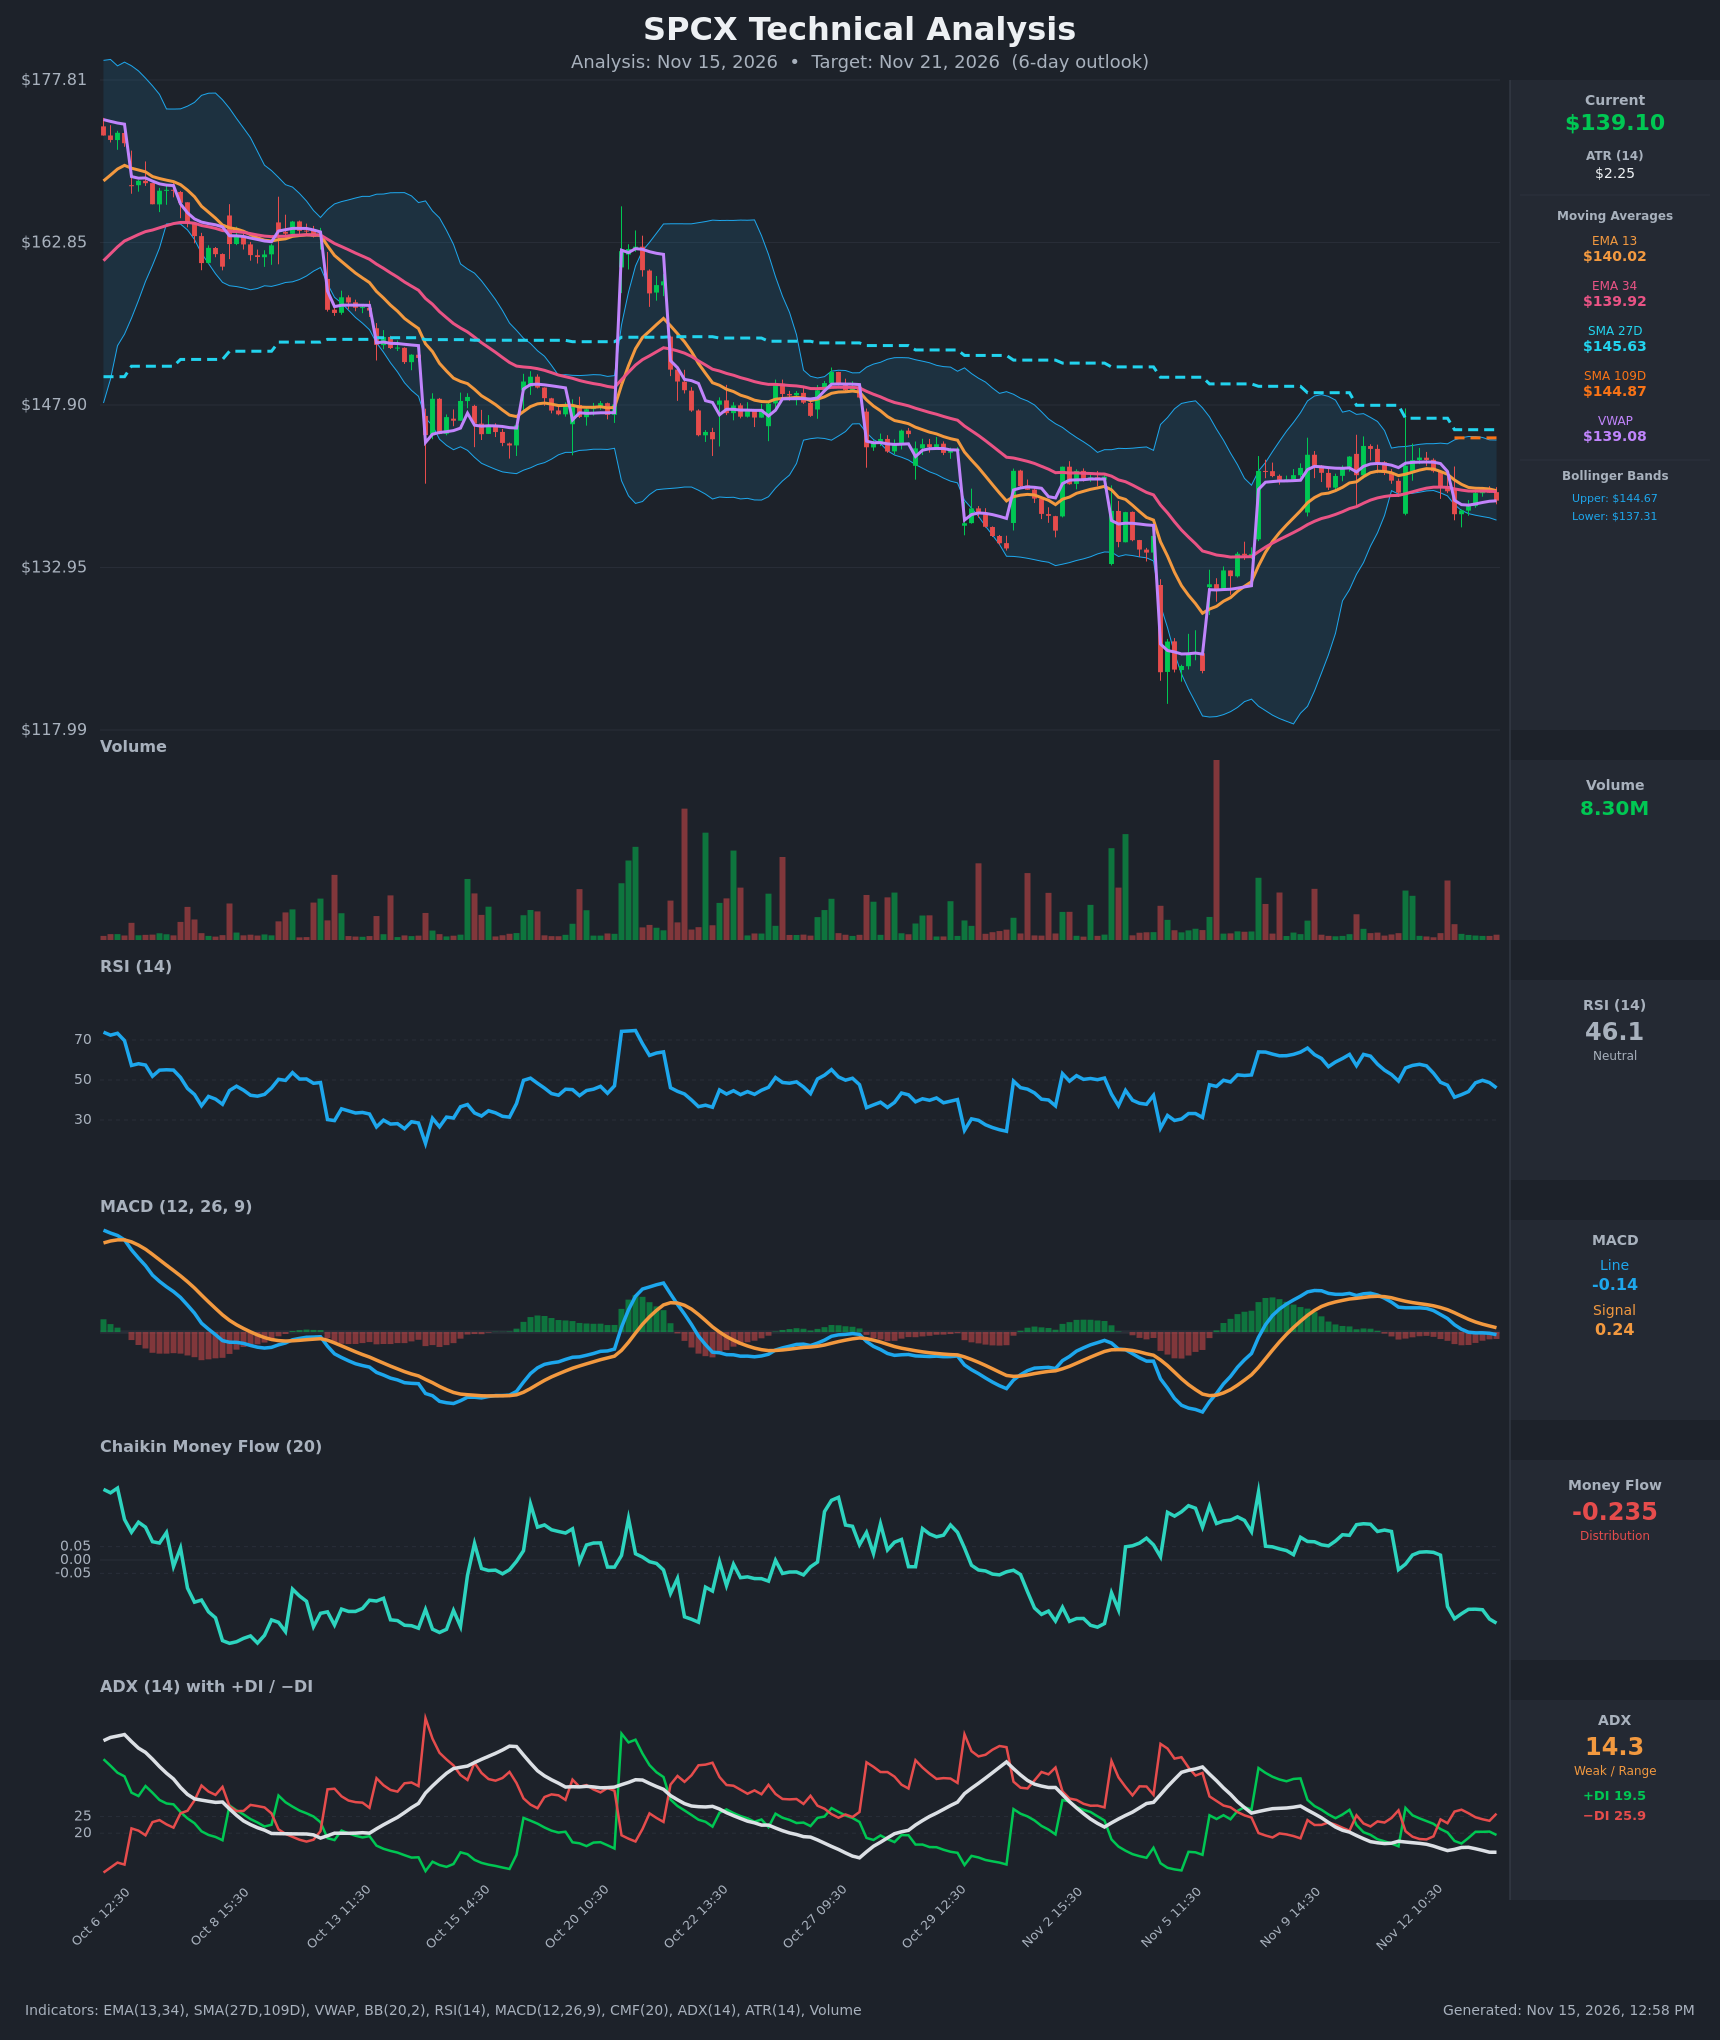
Analysis
TECHNICAL INDICATORS
- RSI (14): 46.06, below the 50 midline and falling from the 57.9 peak on Nov 12. Momentum is fading but not oversold, so there is room to fall further. [Bearish]
- 20 EMA (EMA 13/34 used): EMA 13 is $140.02 and EMA 34 is $139.92. Price at $139.10 is below both, and the EMAs are converging into a flat bundle. The EMA 13 has been rolling over toward the EMA 34 and is on the verge of a bearish cross. [Bearish]
- MACD: Line -0.144 is below signal 0.242, and a bearish crossover occurred on Nov 13 around 11:30. Both lines are falling, and the histogram is negative at about -0.39. The signal line is still above zero but dropping fast. [Bearish]
- Bollinger Bands (20): Upper $144.67, lower $137.31, with a midpoint near $141. Price is in the lower half, about 25% of the band width above the lower band. Bands are narrowing after the earlier expansion, which points to compression. A test of the lower band near $137.3 is plausible. [Bearish]
- CMF (20): -0.235, well below -0.05 and falling steadily from slightly positive on Nov 12. This is clear distribution and selling pressure. [Distribution]
- ADX (14): 14.3, weak and drifting lower. −DI (25.9) is above +DI (19.5), so bears have the directional edge, but the low ADX means there is no strong trend. [Weak Trend, bearish lean]
- Volume: 8.30M, in the low-to-moderate range compared with the earlier spikes. The recent decline is not accompanied by capitulation volume, so conviction is limited, though the CMF shows selling pressure. [Neutral to mildly bearish]
DIVERGENCES & TRENDS
- There is no clear divergence. The RSI and MACD declines match the lower price highs since Nov 12 (the $143.06 peak).
- MACD crossed bearish and is heading toward the zero line. CMF has dropped sharply from about 0 to -0.235, confirming distribution.
- The EMA 13 and EMA 34 are nearly identical ($140.02 vs $139.92), so a bearish cross is imminent. Price is below both.
- Price is well below the SMA27D ($145.63) and SMA109D ($144.87). The SMA27D is above the SMA109D, but both are sloping down and converging, which raises the risk of a death cross. Price remains in the longer-term downtrend.
- Price is near VWAP ($139.08). It is essentially at VWAP, so there is no edge there.
- The broader trend since early October is a series of lower highs and lower lows, with a bounce from the roughly $125 low in early November that has now stalled below $145.
CHART PATTERNS
- The recent price action looks like a small consolidation between about $137.5 and $144, with lower highs. This resembles a Symmetrical Triangle or Bearish Pennant within a larger downtrend. Bands are contracting and ADX is low, which is typical of compression before a breakout.
- The prior drop from $162 to $125 followed by a weak bounce to about $144 resembles a Bearish Flag / failed recovery. The break below the range at roughly $137.3 would target about $133 (an ATR-based measured move) and then the early-November low area near $125-130.
- A bullish alternative is a Double Bottom at roughly $137.5-138, though this is not confirmed.
- On balance, the pattern evidence leans toward a bearish continuation, with moderate confidence given the weak ADX.
POTENTIAL SCENARIOS
- Scenario 1: Bearish Breakdown of Range — Distribution (CMF -0.235), a bearish MACD cross, and −DI above +DI favor a break of the lower Bollinger Band. Trigger: Close below $137.30. Target: $133.50-$135.00. Invalidation: Close above $141.50 (above the EMA bundle and midband). (50% probability)
- Scenario 2: Neutral Range-Bound Chop — Weak ADX and compressed bands keep price oscillating around VWAP and the EMA cluster. Trigger: Holds $137.30-$142. Target: $138-$141. Invalidation: Close outside $137 or $143. (30% probability)
- Scenario 3: Bullish Relief Bounce — Price holds $137.3 support and bounces toward the upper band and SMAs. Trigger: Close above $141.50 with CMF turning up. Target: $144.00-$145.00. Invalidation: Close below $137.00. (20% probability)
PRICE TARGETS
For 6 days, the guideline range width is about 4-8% of the current price. I used about 6.5%: a range of $134.50 to $143.50 is $9.00 wide, or 6.5% of $139.10.
- Target Price: $136.80 (for 6 days)
- Expected Range: $134.50 to $143.50
- Key Levels: Support at $137.30, Resistance at $144.67
OVERALL BIAS
OVERALL BIAS: BEARISH - A bearish MACD crossover, −DI above +DI, CMF at -0.235 (distribution), RSI below 50, and price below both EMAs and both SMAs favor a downside break of the compressed range toward the $133-$137 area. The low ADX limits conviction, so the move may be gradual.
This is educational analysis and not financial advice.