SPCX 4-day bearish forecast — Nov 15, 2026
- Bias: Bearish
- Timeframe: 4 days (made Nov 15, 2026, target date Nov 18, 2026)
- Price at analysis: $139.10
- Price target: $137.60
- Expected range: $134.40 – $141.20
- Result: Pending — graded after the close on Nov 18, 2026
Get a free AI analysis of SPCX today
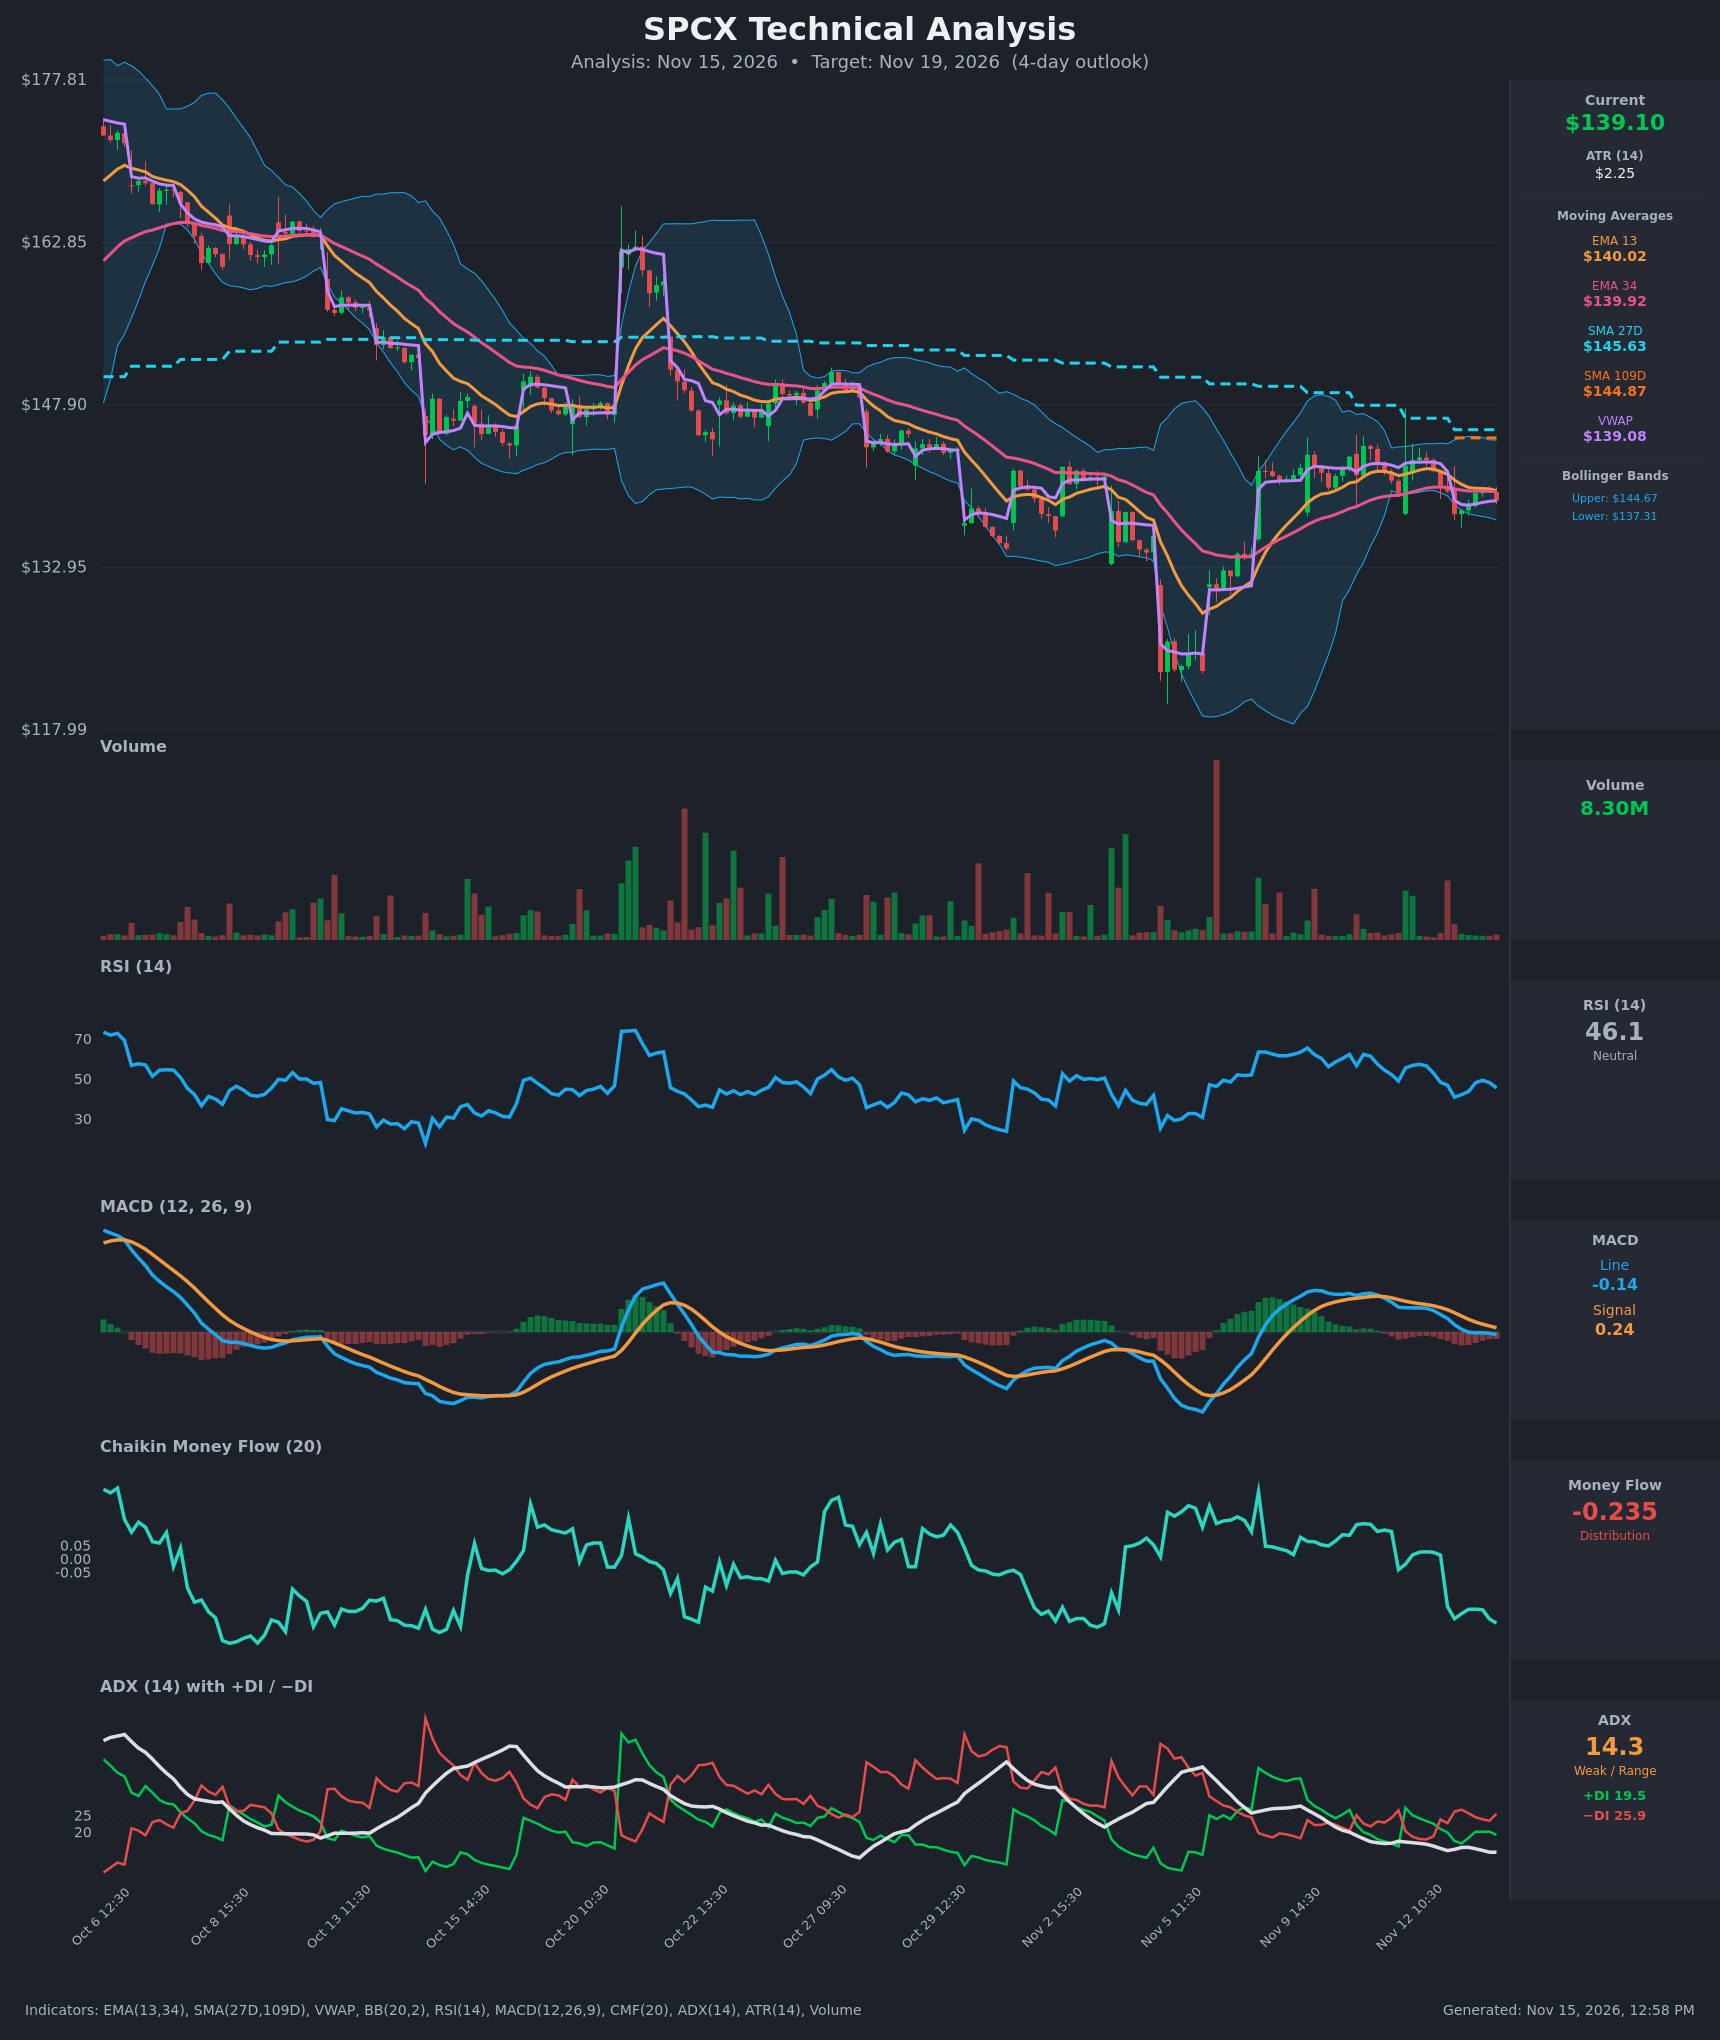
Analysis
TECHNICAL INDICATORS
- RSI (14): 46.06, just under the 50 midline. It has rolled over from 57.9 on Nov 12 and is drifting lower. It is neither overbought nor oversold, and momentum is fading. [Bearish]
- 20 EMA (EMA 13 / EMA 34 used): EMA13 is $140.02 and EMA34 is $139.92. Price at $139.10 sits below both, so they act as near-term resistance. The two EMAs are nearly flat and converging, and EMA13 is about to cross below EMA34. [Bearish]
- MACD: The line is -0.144 and the signal is 0.242, so the line has crossed below the signal and below zero. The histogram is negative (about -0.39) and the line is still falling. [Bearish]
- Bollinger Bands (20): Upper band $144.67, lower band $137.31, so price is in the lower half of the bands, about $1.80 above the lower band. The bands are fairly narrow compared with earlier in the month, which points to contained volatility. A test of the lower band is plausible. [Neutral]
- CMF (20): -0.235 is well below -0.05 and has dropped sharply from positive readings only a few days ago. This is clear distribution and selling pressure. [Distribution]
- ADX (14): 14.3 is below 20, so the trend is weak and the market is range-bound. −DI (25.9) is above +DI (19.5), so bears have a slight directional edge, but there is no trend conviction. [Weak Trend, bearish lean]
- Volume: 8.30M, an average-to-light bar with no capitulation or breakout spike. Recent volume is modest, so the pullback is not being driven by heavy selling, but it is not being bought either. [Neutral to slightly bearish]
DIVERGENCES & TRENDS
- There is no meaningful price/indicator divergence. RSI, MACD and CMF are all confirming the decline from the Nov 12 intraday high of about $143.
- CMF has deteriorated from +0.03 to -0.235 while price fell only about 2.7%. Distribution is outpacing the price decline, which is a bearish warning.
- MACD crossed below its signal around Nov 13 11:30 and is now below zero. The histogram is expanding negatively.
- The −DI/+DI relationship flipped back to bearish on Nov 12 14:30 and has stayed there.
- Price is below the SMA27D ($145.63) and SMA109D ($144.87). SMA27D is above SMA109D, so there is no death cross, but price is under both and the longer trend is down from the $170s in early October.
- Price is slightly below VWAP ($139.08), and the two are almost equal, so there is no strong edge from that.
- The EMA13/EMA34 are about to cross bearishly, but the spread is only $0.09, so this is a weak signal.
CHART PATTERNS
- Since the early-November low near $122, price has rallied to about $143 and is now rolling over beneath the declining SMAs. The structure is a Bearish Rising Wedge / bearish flag-type pullback within the broader downtrend. It is a loose fit, not a textbook one.
- The 4-day price action is contained between about $137.50 and $143.50, which is range-like. A break below the $137.3-$137.9 area (lower Bollinger Band and the Nov 13 low) would extend the move toward $134-$135.
- There is no clean Head & Shoulders or Double Top. The longer trend remains a series of lower highs, which favours continuation lower.
POTENTIAL SCENARIOS
- Scenario 1: Bearish Drift Toward the Lower Band — Distribution (CMF -0.235), a negative MACD crossover and −DI dominance point to a grind lower below the EMAs. Trigger: a break below $137.85 (Nov 13 low) and the lower Bollinger Band at $137.31. Target: $134.50-$136.00. Invalidation: a close back above $140.50 (EMA13/EMA34 zone). (50% probability)
- Scenario 2: Neutral Range Chop — With ADX at 14, price oscillates around VWAP and the EMAs between about $137.50 and $141.50. Trigger: no decisive break of either side. Target: $138.00-$140.50. Invalidation: a close below $137.30 or above $142.00. (30% probability)
- Scenario 3: Bullish Mean-Reversion Bounce — Price holds near the lower band, RSI turns up from the mid-40s, and price retakes the EMAs. Trigger: a close above $140.50 with improving volume. Target: $143.00-$144.50 (upper band and SMA109D). Invalidation: a fall back below $138.00. (20% probability)
PRICE TARGETS
For the 4-day timeframe, the range width should be about 2-4% of the current price, widened slightly to reflect the ATR of $2.25.
- Target Price: $137.60 (for the 4-day horizon)
- Expected Range: $134.40 to $141.20. Width is $6.80, about 4.9% of the current price. This is somewhat wider than the 2-4% guide because ATR is roughly 1.6% per bar and the daily range is wide, but it stays tight for the 4-day window.
- Key Levels: Support at $137.31 (lower Bollinger Band), Resistance at $140.02 (EMA13)
OVERALL BIAS
OVERALL BIAS: BEARISH - Price is below both EMAs with an expanding negative MACD crossover, CMF at -0.235 showing clear distribution, −DI above +DI, and price under the SMA27D and SMA109D in a longer-term downtrend. Weak ADX tempers conviction, so a drift toward the lower band is more likely than a sharp breakdown.
This is educational analysis and not financial advice.