TQQQ 6-day bearish forecast — Nov 15, 2026
- Bias: Bearish
- Timeframe: 6 days (made Nov 15, 2026, target date Nov 20, 2026)
- Price at analysis: $57.67
- Price target: $56.60
- Expected range: $54.70 – $59.20
- Result: Pending — graded after the close on Nov 20, 2026
Get a free AI analysis of TQQQ today
Analysis
TECHNICAL INDICATORS
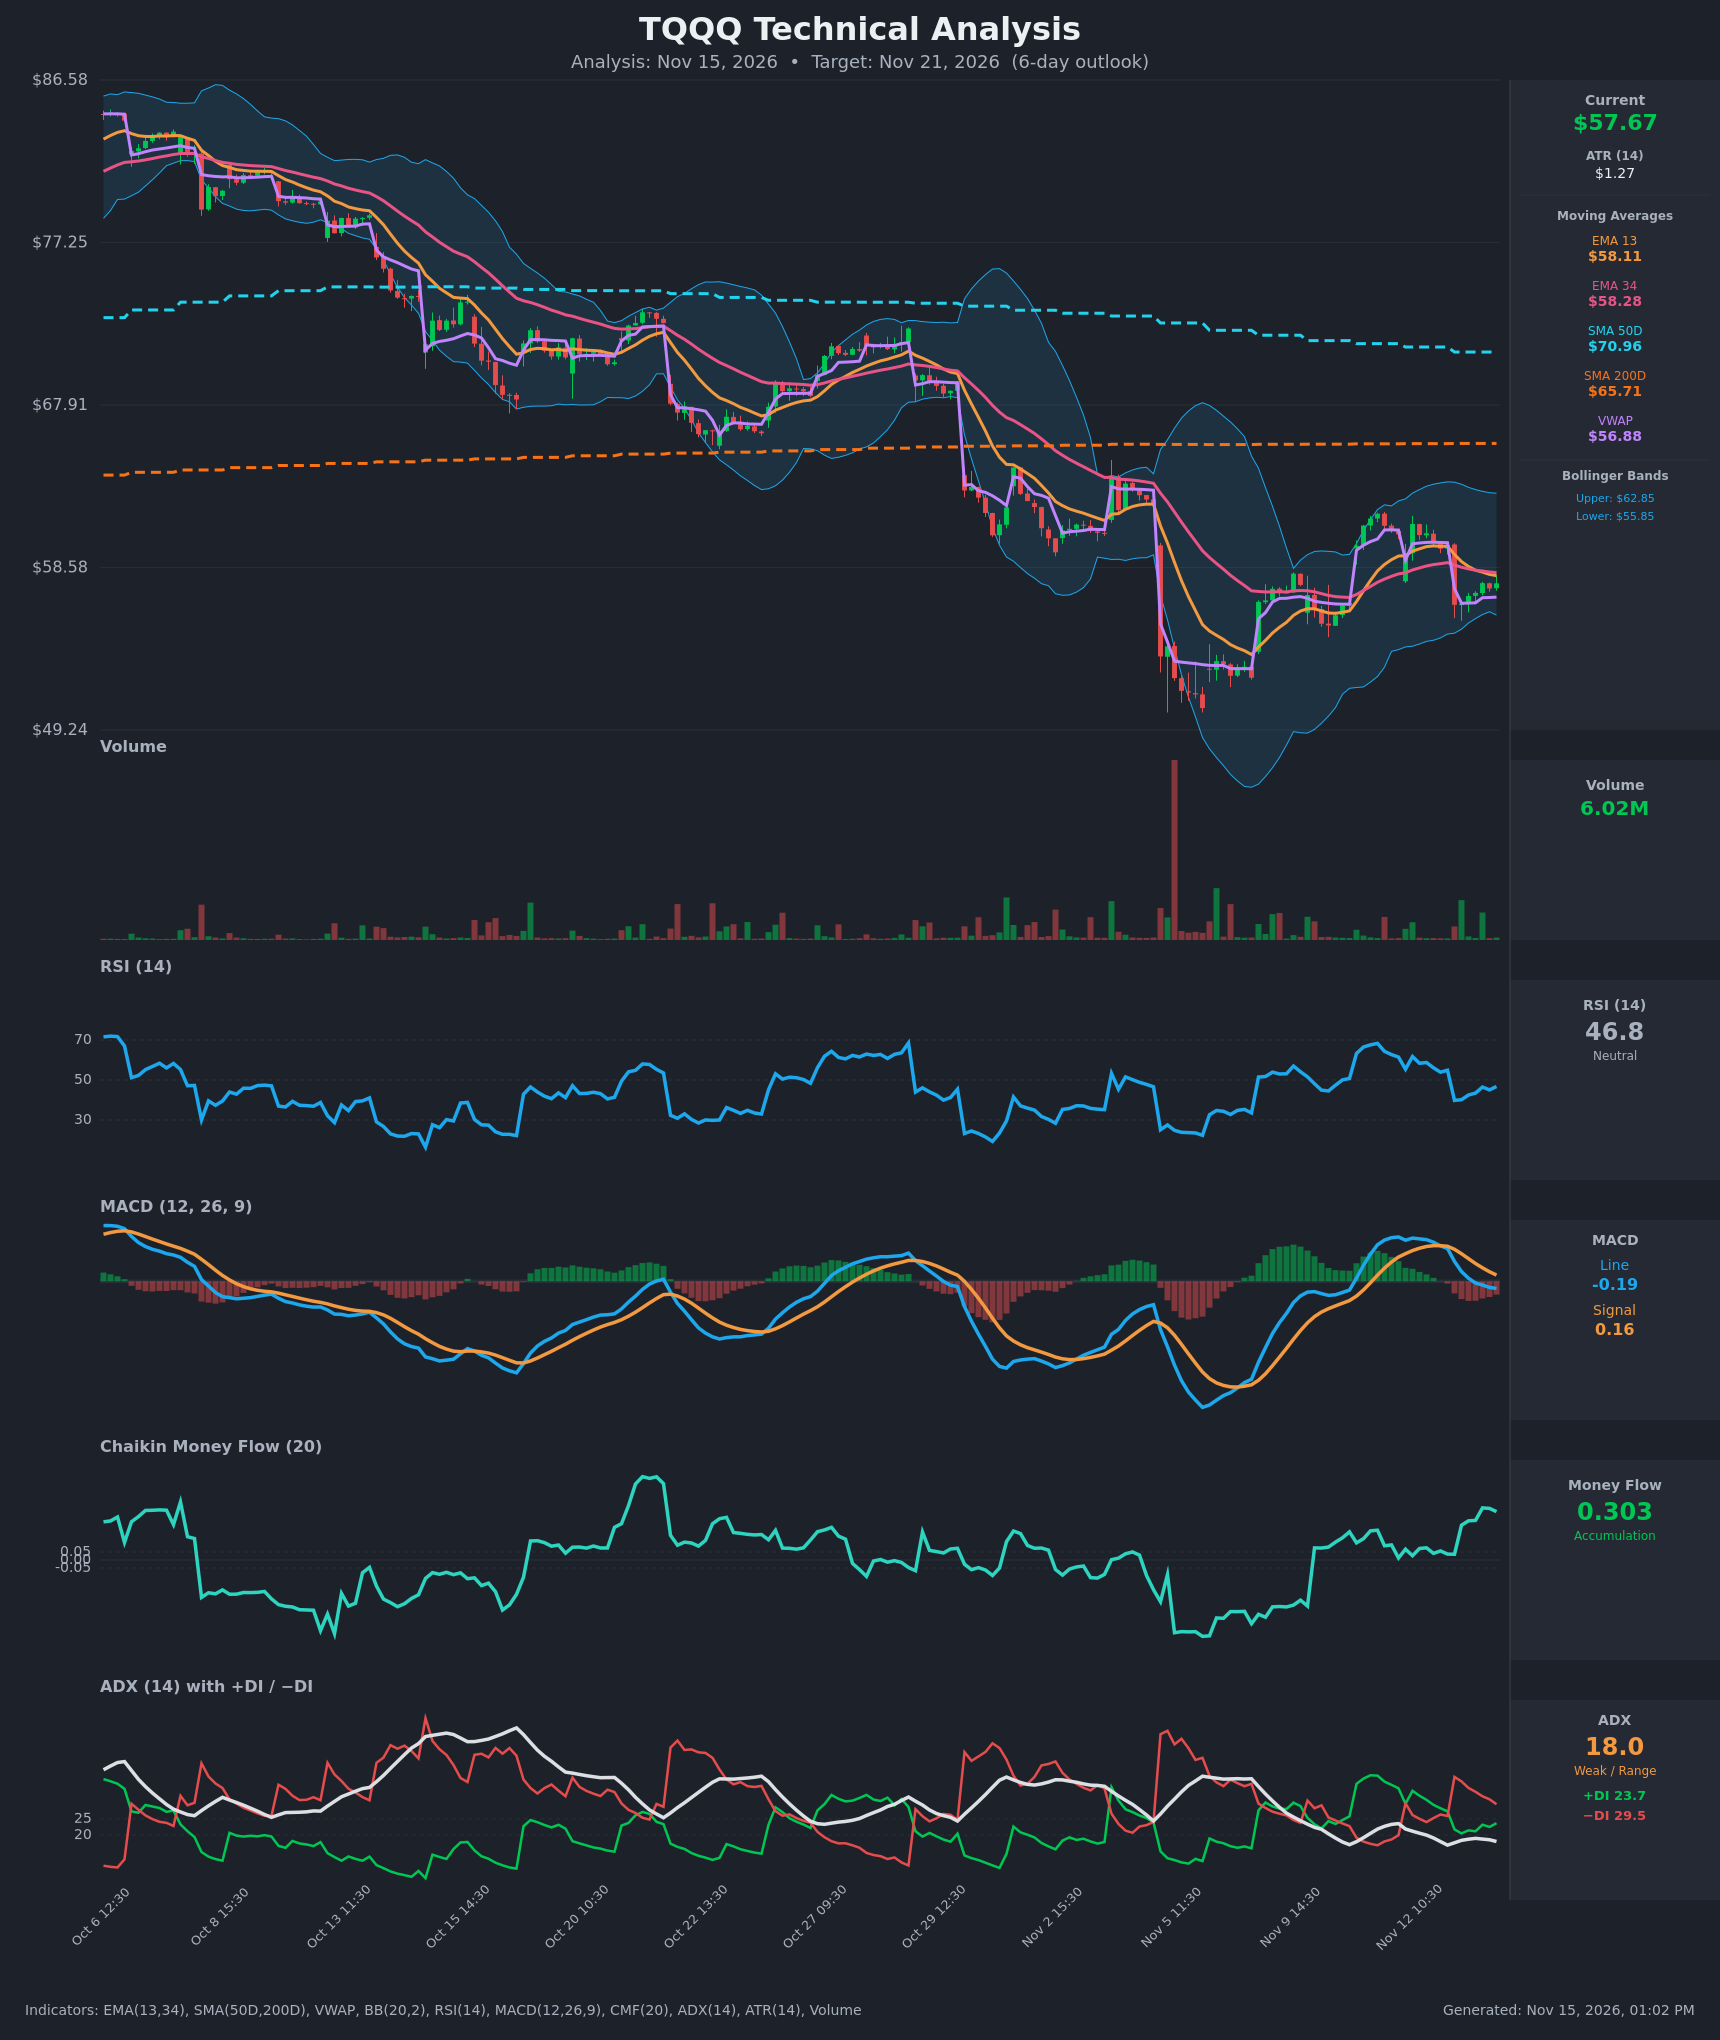
- RSI (14): 46.75, just below the 50 midline. It dropped from 61.5 (Nov 11) to a low of 39.8 on the Nov 13 gap down, then partially recovered to the mid-40s. Momentum is neutral to slightly weak, with no overbought or oversold signal. [Neutral]
- 20 EMA: Only the EMA 13 ($58.11) and EMA 34 ($58.28) are provided, so I use them as the short-term proxy. Price at $57.67 is below both. EMA13 crossed below EMA34 on Nov 13 (around 12:30), a bearish cross. The cluster at $58.1–$58.3 is overhead resistance. [Bearish]
- MACD: Line -0.187 is below the signal at 0.162, a bearish crossover that occurred around Nov 13 12:30. The histogram is negative (-0.35), and the line has just slipped below zero. The gap to the signal line is narrowing slightly in the last few bars, so downside momentum is fading but not reversed. [Bearish]
- Bollinger Bands (20): Upper $62.85, lower $55.85, so the mid-band is about $59.35. Price sits in the lower third of the bands. The bands are relatively narrow after the earlier volatility expansion, which points to a contained move rather than a breakout. Price is below the mid-band, a mild negative. [Neutral]
- CMF (20): 0.303, well above +0.05. It has been rising since Nov 13 (0.036 to 0.327) even as price fell and stabilized, which is clear accumulation and a notable positive divergence. [Accumulation]
- ADX (14): 18.0, below 20, so the trend is weak and range-bound. −DI (29.5) is above +DI (23.7), so bears hold a modest edge, but the spread is narrowing (it was 37.9 vs 21.8 on Nov 13 open). [Weak Trend, Bearish lean]
- Volume: 6.02M on the latest bar, moderate. The huge volume spike earlier in the month marked the capitulation low near $50–$51. Recent volume is unremarkable, with slightly larger green bars on the bounce. There is no strong volume confirmation either way. [Neutral]
DIVERGENCES & TRENDS
- Positive divergence (CMF vs price): CMF rose from about 0.04 to 0.30 while price fell from about $60 to about $57.67. This suggests buyers absorbed the Nov 13 selloff.
- VWAP: Price ($57.67) is above VWAP ($56.88), a mild short-term positive.
- MACD: The bearish cross and the EMA13/EMA34 bearish cross both occurred on Nov 13. The gap down from $59.86 to $56.44 broke the short-term uptrend that began from the early-November low.
- Long-term trend: Price is far below SMA50D ($70.96) and SMA200D ($65.71), and SMA50 is falling toward SMA200, a potential death cross if the decline continues. The larger trend since the $86 high is clearly down, with lower highs.
- ADX/DI: −DI is on top but the spread is narrowing, and ADX is under 20. This points to a choppy, low-conviction environment.
CHART PATTERNS
- Primary: The prior decline from about $86 to about $50 followed by a rebound and a rangebound consolidation resembles a Bearish Flag/Pennant continuation at a smaller scale. Price made a lower high near $61–$62 (Nov 12) after the bounce from about $50, then gapped down. A break below $56.44 would point toward the lower Bollinger Band area and then $55 and below.
- Alternate (less likely): A Bullish Double Bottom-type base is forming around $56.4–$57 on the recent hourly bars, supported by the CMF accumulation. A close above $58.3 and then $59.4–$60 would activate the bullish read, targeting the $61–$62.8 band area.
- Pattern significance is modest because ADX is low and the pattern boundaries are loosely defined.
POTENTIAL SCENARIOS
- Scenario 1: Bearish Rejection at EMA Cluster — Price fails at the $58.1–$58.3 EMA13/34 resistance, the bearish MACD and DI structure dominates, and price drifts back toward the Nov 13 low and the lower Bollinger Band. Trigger: rejection at $58.3 or a break below $56.44. Target: $55.85–$56.50. Invalidation: a close above $59.40 (Bollinger mid-band). (45% probability)
- Scenario 2: Bullish CMF-Driven Recovery — Accumulation (CMF 0.30) and price above VWAP carry price through the EMA cluster, filling part of the Nov 13 gap. Trigger: a close above $58.30 with rising volume. Target: $59.50–$60.50. Invalidation: a drop below $56.44. (32% probability)
- Scenario 3: Neutral Range Chop — With ADX at 18, price oscillates between $56.4 and $58.3 without a decisive break. Trigger: failure to break either boundary. Target: $57.00–$58.00. Invalidation: a close outside $56.40–$58.50. (23% probability)
PRICE TARGETS
- Target Price: $56.60 (6-day horizon)
- Expected Range: $54.70 to $59.20 (width $4.50, about 7.8% of the current price, consistent with the 4–8% guidance for 7–10 days and appropriate for 6 days)
- Key Levels: Support at $55.85 (lower Bollinger Band, just below the Nov 13 low of $56.44), Resistance at $58.28 (EMA 34 / EMA cluster)
OVERALL BIAS
OVERALL BIAS: BEARISH - Price is below the EMA13/34 after a bearish EMA and MACD crossover, −DI leads +DI, and the larger trend remains well below both the SMA50 and SMA200. The strong CMF accumulation limits the downside, so the expected decline is modest, with a target of about $56.60.
This is educational analysis and not financial advice.