TQQQ 4-day bearish forecast — Nov 15, 2026
- Bias: Bearish
- Timeframe: 4 days (made Nov 15, 2026, target date Nov 18, 2026)
- Price at analysis: $57.67
- Price target: $56.70
- Expected range: $55.20 – $59.00
- Result: Pending — graded after the close on Nov 18, 2026
Get a free AI analysis of TQQQ today
Analysis
TECHNICAL INDICATORS
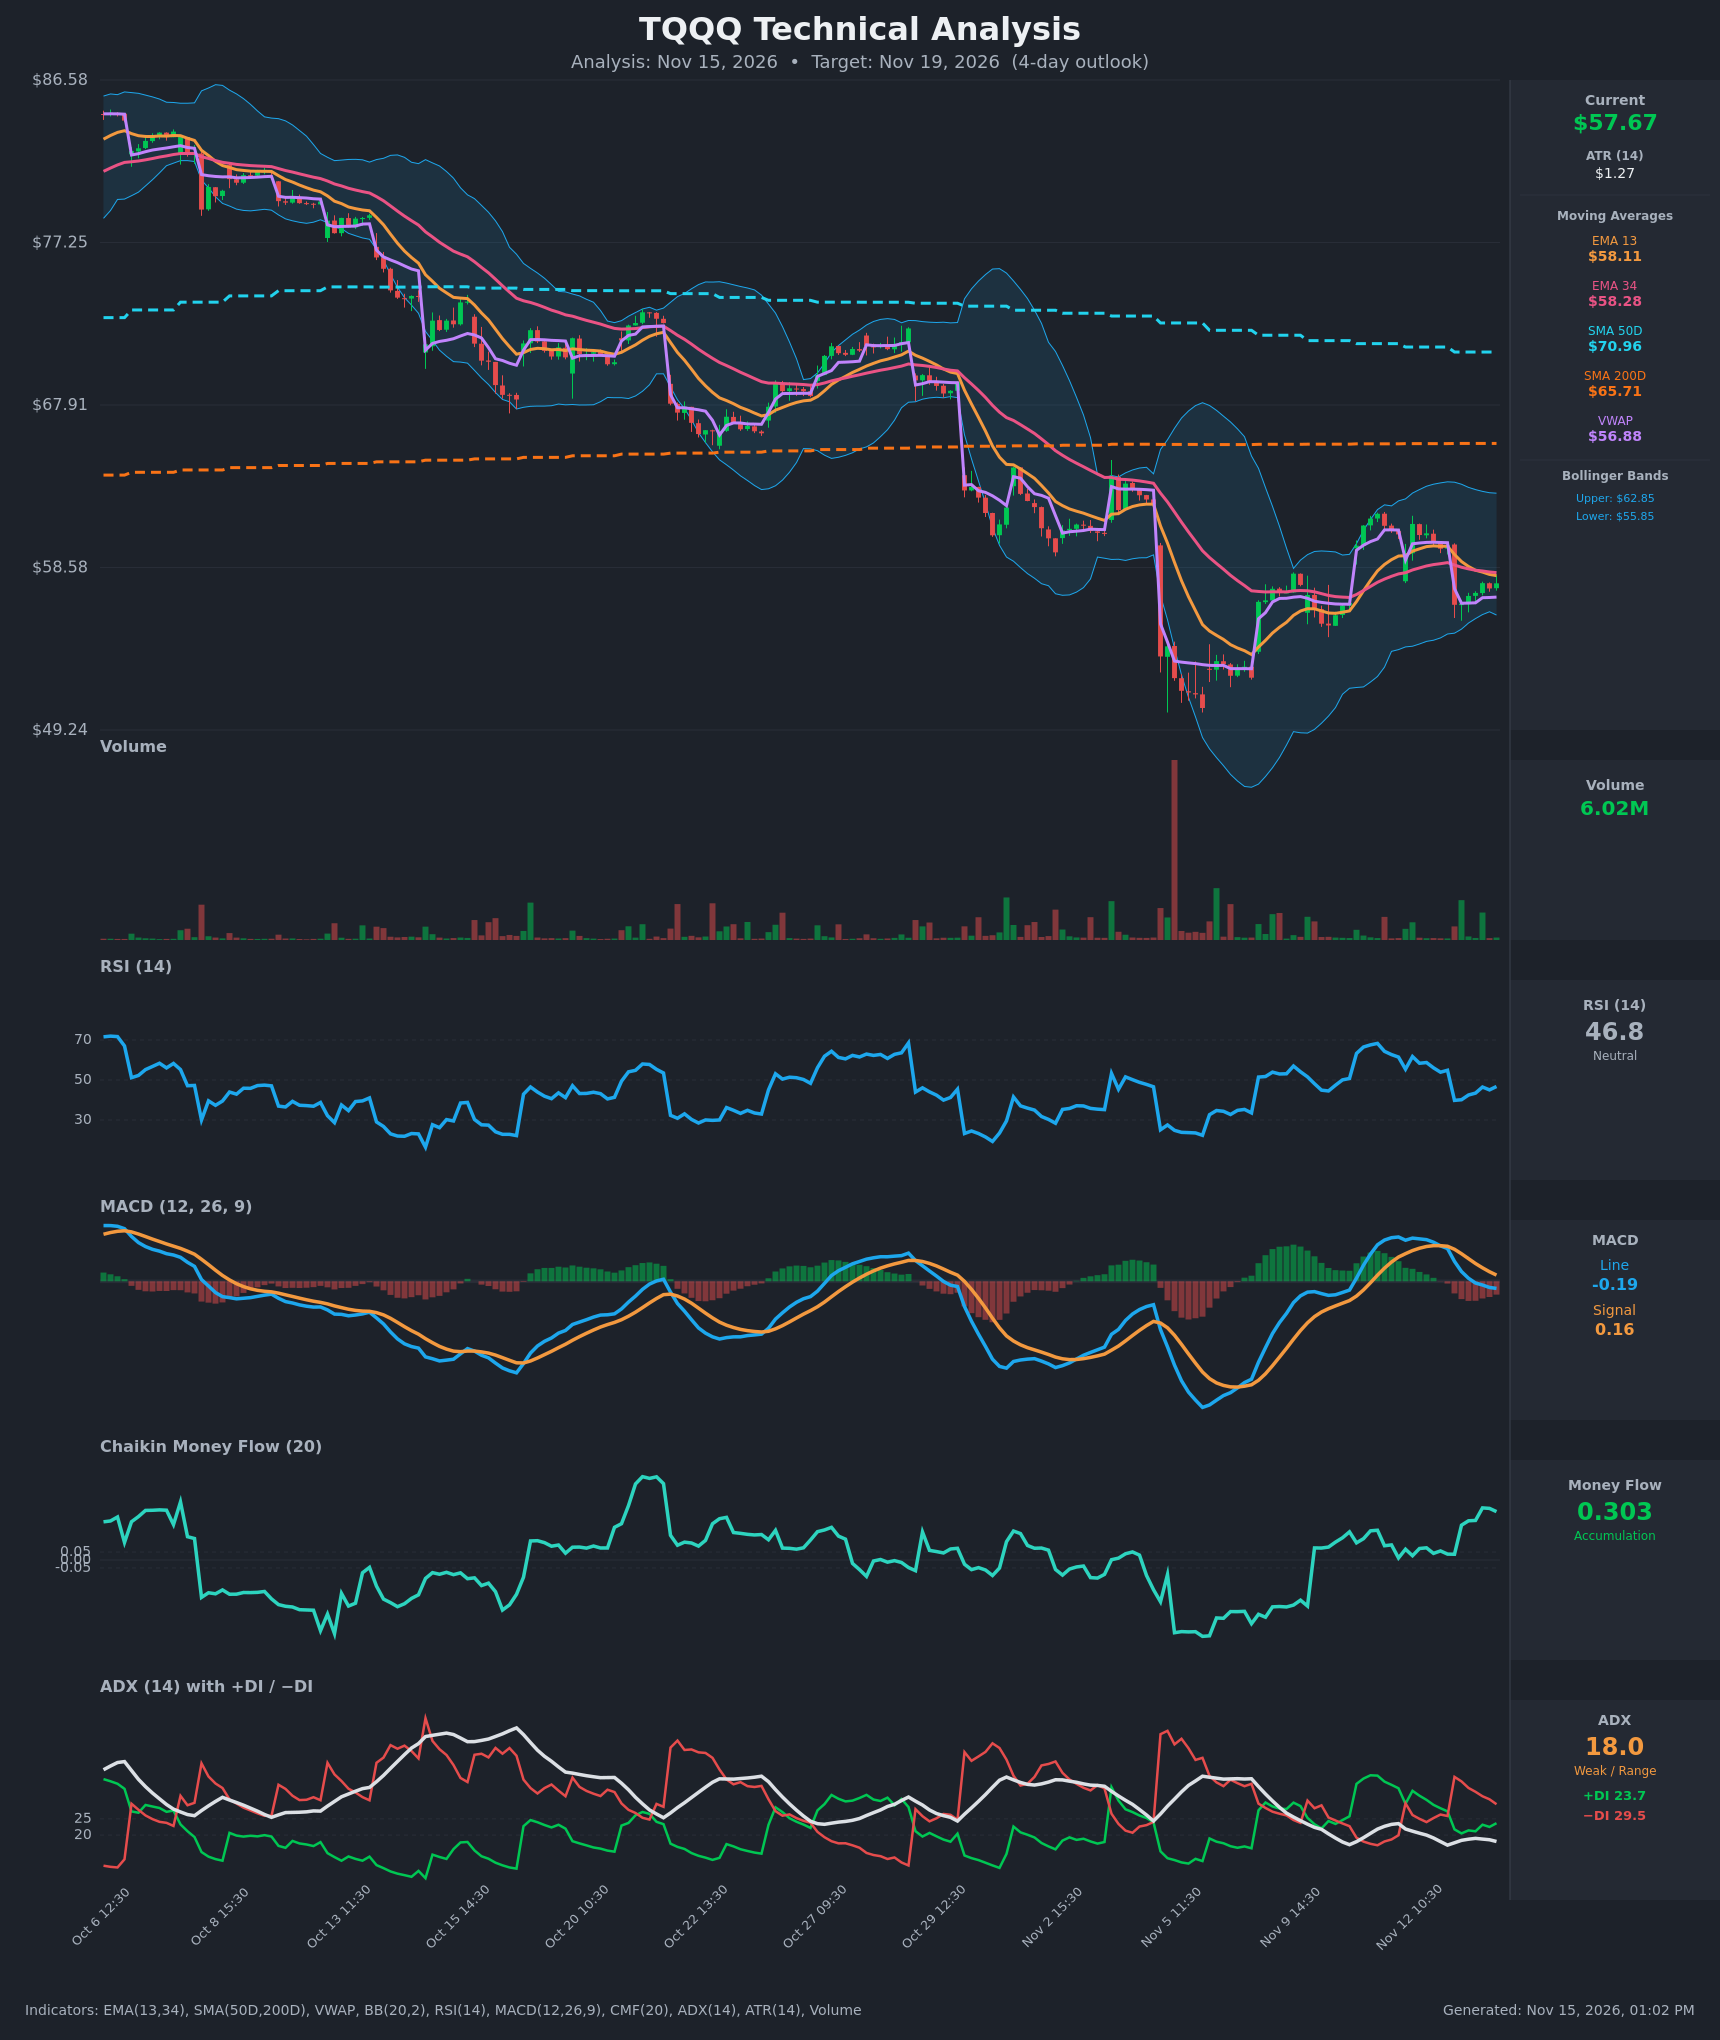
- RSI (14): 46.75, just below the 50 midline. It dropped from 61.7 to 39.8 on the Nov 13 gap-down and has recovered only partially, so momentum is neutral to slightly weak. It is far from oversold, so there is room to fall further. [Neutral]
- 20 EMA: The chart shows EMA 13 at $58.11 and EMA 34 at $58.28. Price at $57.67 is below both, and EMA 13 crossed below EMA 34 on Nov 13 at 12:30. The cluster at $58.1–$58.3 is overhead resistance. [Bearish]
- MACD: The line is at -0.19 and the signal at 0.16. The line crossed below the signal around Nov 12 15:30 to Nov 13 09:30 and has just crossed below zero. The histogram is negative (about -0.35) and still widening. [Bearish]
- Bollinger Bands (20): Upper band $62.85, lower $55.85, midline about $59.35. Price is in the lower half of the bands, below the midline, with the lower band about $1.82 away (roughly 1.4 ATR). The bands are fairly narrow compared with early November, which suggests contained volatility. [Neutral]
- CMF (20): 0.303, well above +0.05 and rising since Nov 13. Buying pressure was strong during the bounce. This is the main bullish offset to the price structure. [Accumulation]
- ADX (14): 18.0, below 20, so the trend is weak or range-bound. −DI (29.5) is above +DI (23.7), so sellers hold a modest edge. −DI has been on top since the Nov 13 gap-down, although the gap between them is narrowing. [Weak Trend + Bearish tilt]
- Volume: 6.02M, with some higher-volume green bars on the bounce after the gap. The big volume spike was the Nov 5 capitulation low near $50. Current volume is unremarkable and gives no strong confirmation either way. [Neutral]
Other levels:
- VWAP: $56.88, which price is holding above (modestly bullish intraday support).
- SMA50D: $70.96, falling.
- SMA200D: $65.71, flat to rising.
- Long-term position: Price is below both SMAs, which confirms a long-term downtrend. SMA50D is still above SMA200D, so there is no death cross yet.
DIVERGENCES & TRENDS
- CMF vs. momentum: CMF (0.30) is strongly positive while MACD and the DI lines are rolling over. This is a divergence between flow and trend. Accumulation could support a base, but price has not yet reclaimed the EMAs.
- RSI confirmation: Price and RSI rose together off the Nov 13 low ($56.44 to $57.67, RSI 39.8 to 46.8), so there is no divergence. The bounce is a recovery inside a downtrend, not a reversal.
- MACD cross: The bearish cross and the move below zero show short-term momentum has turned down after the Nov 11–12 spike.
- EMA cross: EMA 13 crossing below EMA 34 is a short-term bearish signal. The spread is small ($0.18), so a recovery above $58.3 would quickly negate it.
- Larger trend: Since early October the chart shows lower highs and lower lows from about $86 to $50. The Nov 5 bounce has stalled around $61, a lower high.
- DI trend: −DI has been above +DI since the Nov 13 gap, but ADX at 18 means no trend is established.
CHART PATTERNS
- Bearish Flag / Rising Wedge (continuation, tentative): After the Nov 13 gap-down, price has drifted upward in a small, low-momentum channel beneath the converging EMA 13/34. This resembles a bearish flag or rising wedge from the reference diagram. The measured target is a retest of the lower Bollinger Band at about $55.85. The pattern is small and not fully confirmed.
- Lower-high structure (Double Top-like): The two highs near $61 on Nov 11–12, below the prior October highs, point to waning upside momentum. A break below $56.44 would strengthen the bearish case.
- Bullish counter-evidence: Strong CMF and price holding above VWAP could set up a base near $56.4–$56.9 (a possible Triple Bottom or Double Bottom shape on the hourly chart). It is not confirmed without a break above $58.3 or higher.
POTENTIAL SCENARIOS
- Scenario 1: Bearish Rejection at EMA Cluster — Price fails at the EMA 13/34 resistance near $58.1–$58.3, the bearish MACD and DI structure persists, and sellers push price back toward the Nov 13 gap low and the lower Bollinger Band. Trigger: rejection at $58.3 or a break below $56.88 (VWAP). Target: $55.85–$56.45. Invalidation: a close above $58.50 holding on volume. (45% probability)
- Scenario 2: Bullish Reclaim on Accumulation — Strong CMF accumulation carries price above the EMA cluster, and the MACD histogram begins to flatten. Trigger: break and hold above $58.30. Target: $59.35 (BB midline) up to $60.50. Invalidation: a drop back below $56.88 (VWAP). (30% probability)
- Scenario 3: Neutral Chop Below the EMAs — With ADX under 20, price oscillates between VWAP and the EMA cluster. Trigger: failure to break either $56.45 or $58.30 on a closing basis. Target: $56.90–$58.30. Invalidation: a decisive close outside the $56.45–$58.50 band. (25% probability)
PRICE TARGETS
- Target Price: $56.70 (4-day horizon, about -1.7% from $57.67)
- Expected Range: $55.20 to $59.00 (width $3.80, about 6.6% of current price, consistent with a 4-day horizon of roughly 1.7 ATR per side)
- Key Levels: Support at $55.85 (lower Bollinger Band), Resistance at $58.28 (EMA 34 and EMA 13 cluster)
OVERALL BIAS
OVERALL BIAS: BEARISH - Price sits below the declining EMA cluster with a bearish MACD cross, −DI above +DI, and a long-term downtrend below both SMAs. The strong CMF and price above VWAP limit conviction, so the expected decline is modest (target near $56.70).
This is educational analysis and not financial advice.