SMCI 4-day bearish forecast — Nov 15, 2026
- Bias: Bearish
- Timeframe: 4 days (made Nov 15, 2026, target date Nov 18, 2026)
- Price at analysis: $26.87
- Price target: $26.35
- Expected range: $25.55 – $27.30
- Result: Pending — graded after the close on Nov 18, 2026
Get a free AI analysis of SMCI today
Analysis
TECHNICAL INDICATORS
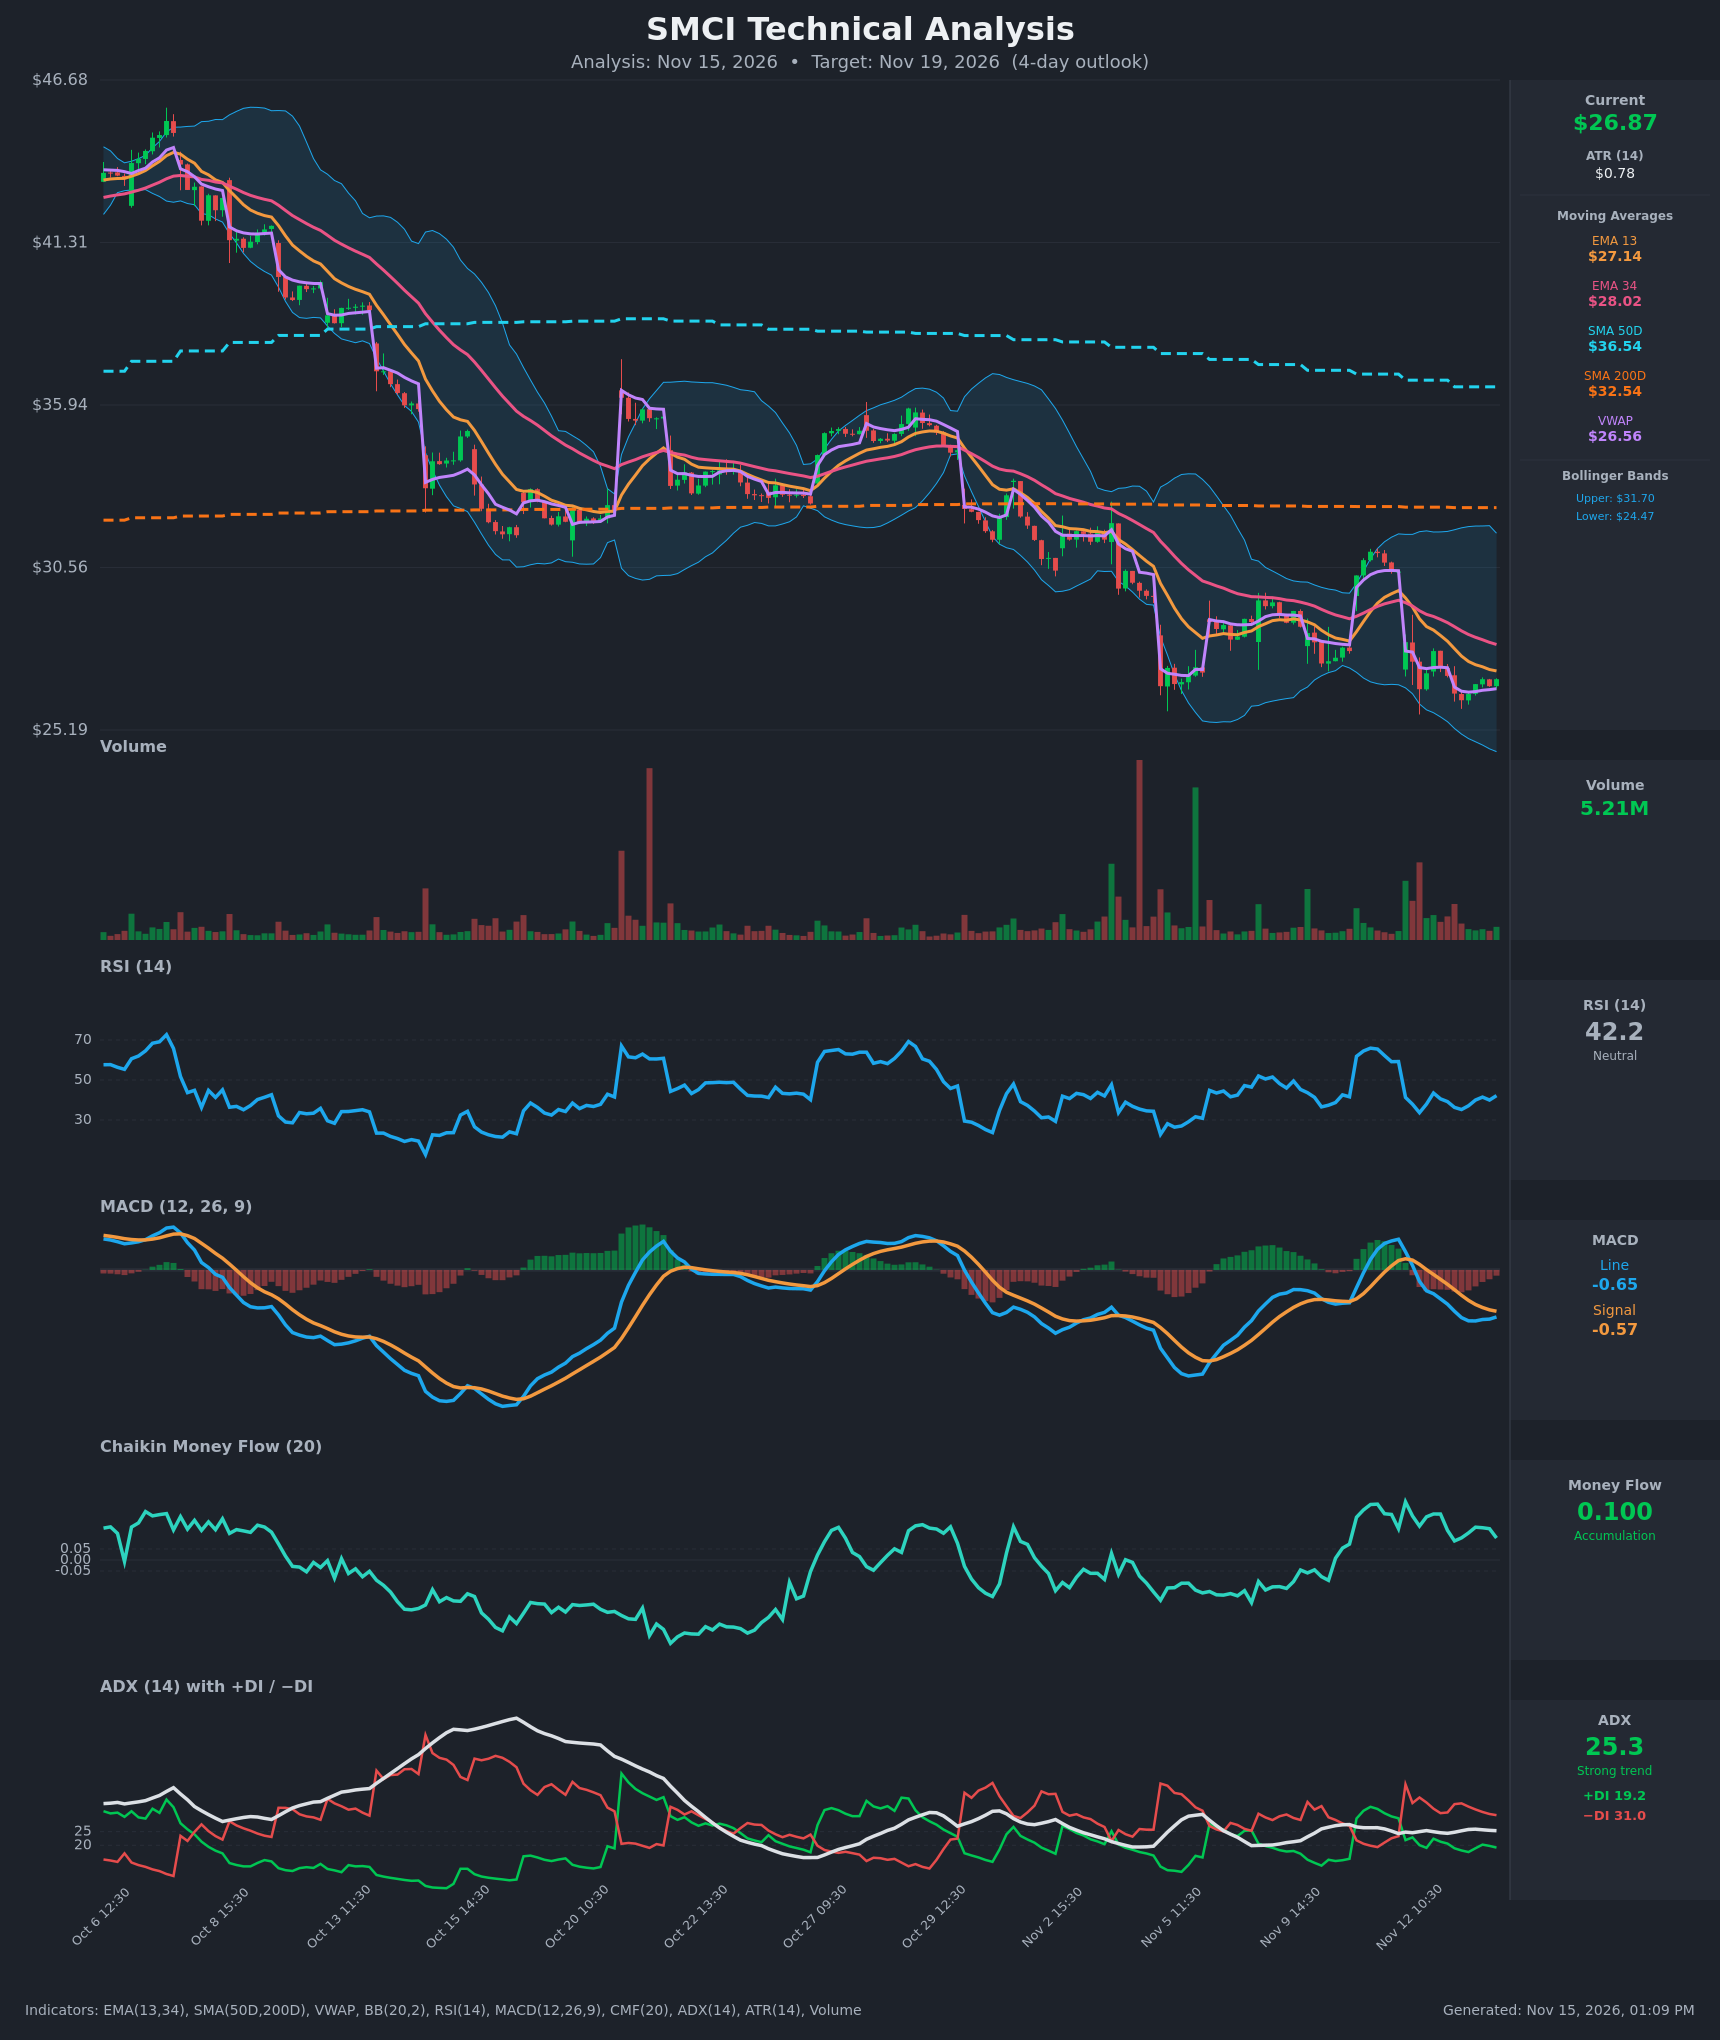
- RSI (14): 42.19, below the 50 midline but above oversold. It bounced from 33.7 (Nov 12) and has been making higher lows (35.2 → 42.2) while price chopped sideways. Momentum is bearish-leaning but stabilizing. [Neutral]
- 20 EMA: The data supplies EMA 13 ($27.14) and EMA 34 ($28.02). Price at $26.87 is below both. EMA13 is below EMA34 and both are sloping down, so they act as overhead resistance. [Bearish]
- MACD: Line -0.651 is below signal -0.572, a bearish cross that occurred around Nov 12 and remains in force. The line has flattened since Nov 13 (-0.706 → -0.651) and the histogram is shrinking (about -0.08). That points to fading downside momentum but no bullish cross yet. [Bearish]
- Bollinger Bands (20): Upper $31.70, lower $24.47, midline about $28.09. Price is in the lower half, roughly 27% of the band width from the lower band. Bands are wide after a volatile week. There is room to the downside, but there is no squeeze or extreme reading. [Bearish]
- CMF (20): +0.100 is above the +0.05 threshold, meaning accumulation. It is the one constructive reading and sits against the weak price trend, but it has eased from 0.265. [Accumulation]
- ADX (14): 25.3 with −DI 31.0 above +DI 19.2. That is a strong trend, controlled by sellers. ADX is flat at about 25, so trend strength is steady rather than accelerating. [Strong Trend – Bearish]
- Volume: 5.21M is moderate and about average. The big spikes on the chart came on the Nov 5 flush and the Nov 12 selloff. Recent bars are quiet, which fits a consolidation or base-building phase after capitulation-like volume. [Neutral]
DIVERGENCES & TRENDS
- Price is below VWAP's anchored levels in the long term, but at $26.87 it sits just above the current VWAP ($26.56). That is a modest short-term positive.
- RSI is making higher lows while price makes marginally lower or equal lows (Nov 13: $26.18 vs. Nov 12: $26.54). This is a mild bullish divergence, though not decisive.
- CMF remains positive (0.10) while price sits near its lows, which suggests quiet accumulation and is also mildly bullish.
- Against that, the MACD bearish cross, −DI dominance and the EMA13 < EMA34 stack are all intact.
- Price is below SMA200 ($32.54) and SMA50 ($36.54), and SMA50 is well above SMA200 only because of past strength. SMA50 is falling toward SMA200, so a death cross is likely in the coming weeks. The long-term trend is clearly down.
- Over the last 15 bars, price fell from $30.43 to about $26.87 and has been consolidating around $26.2–$27.8 since Nov 12.
CHART PATTERNS
- The broader chart shows a persistent downtrend of lower highs and lower lows since early October. The rebounds to $30.5 and $35 both failed.
- The last few days resemble a small Bearish Flag / Pennant, a tight consolidation after the sharp drop from $30.43 to $26.5. If it resolves down, the measured move is about $3–4, which points toward the lower Bollinger Band area ($24.5) and beyond. That is a longer-horizon target.
- A Double Bottom is possible in the $26.2–$26.4 area, with a neckline near $27.80. It is unconfirmed, and RSI and CMF divergences give it some credibility.
- Over a 4-day window, the likeliest outcome is a drift lower or a retest of EMA13 resistance near $27.1–$27.3, with sellers defending that zone.
POTENTIAL SCENARIOS
- Scenario 1: Bearish Flag Breakdown — price fails at EMA13 (about $27.1) and breaks the $26.2 low, with −DI still dominant. Trigger: close below $26.18 on rising volume. Target: $25.20–$25.50, then the lower band at $24.47. Invalidation: close above $27.80. (50% probability)
- Scenario 2: Neutral Base and Chop — price holds $26.2–$27.2, supported by CMF accumulation and the higher RSI lows, and MACD histogram compresses further. Trigger: repeated defense of $26.2 with low volume. Target: $26.40–$27.20. Invalidation: break of either $26.18 or $27.80. (28% probability)
- Scenario 3: Bullish Relief Bounce — the double-bottom and divergence setup plays out, with a push through EMA13/EMA34. Trigger: close above $27.80 with volume. Target: $28.00–$28.50 (EMA34 / Bollinger midline). Invalidation: close below $26.18. (22% probability)
PRICE TARGETS
For the 4-day timeframe, the range width should be about 2–4% to 4–8% of price. A 4-day window sits between those bands, so I use roughly 6.5%. The range is $26.00 to $27.75, a width of $1.75, which is 6.5% of $26.87.
- Target Price: $26.35 (4 days from now)
- Expected Range: $25.55 to $27.30
- Key Levels: Support at $26.18, Resistance at $27.14
Self-check: the width is $27.30 − $25.55 = $1.75, or 6.5% of $26.87. This is consistent with the 4-day timeframe (ATR $0.78 over 4 days is about ±$1.55 at 1 sigma). The target is below current price, consistent with a bearish bias.
OVERALL BIAS
OVERALL BIAS: BEARISH - Price is below all key moving averages, MACD is below its signal line and −DI (31.0) dominates +DI (19.2) with ADX at 25.3. The bounce is capped by EMA13 near $27.14. The higher RSI lows and positive CMF limit the downside, which is why the target is a modest drift to about $26.35 rather than a breakdown to the lower band.
This is educational analysis and not financial advice.