SMCI 6-day bearish forecast — Nov 15, 2026
- Bias: Bearish
- Timeframe: 6 days (made Nov 15, 2026, target date Nov 20, 2026)
- Price at analysis: $26.87
- Price target: $26.20
- Expected range: $24.30 – $28.30
- Result: Pending — graded after the close on Nov 20, 2026
Get a free AI analysis of SMCI today
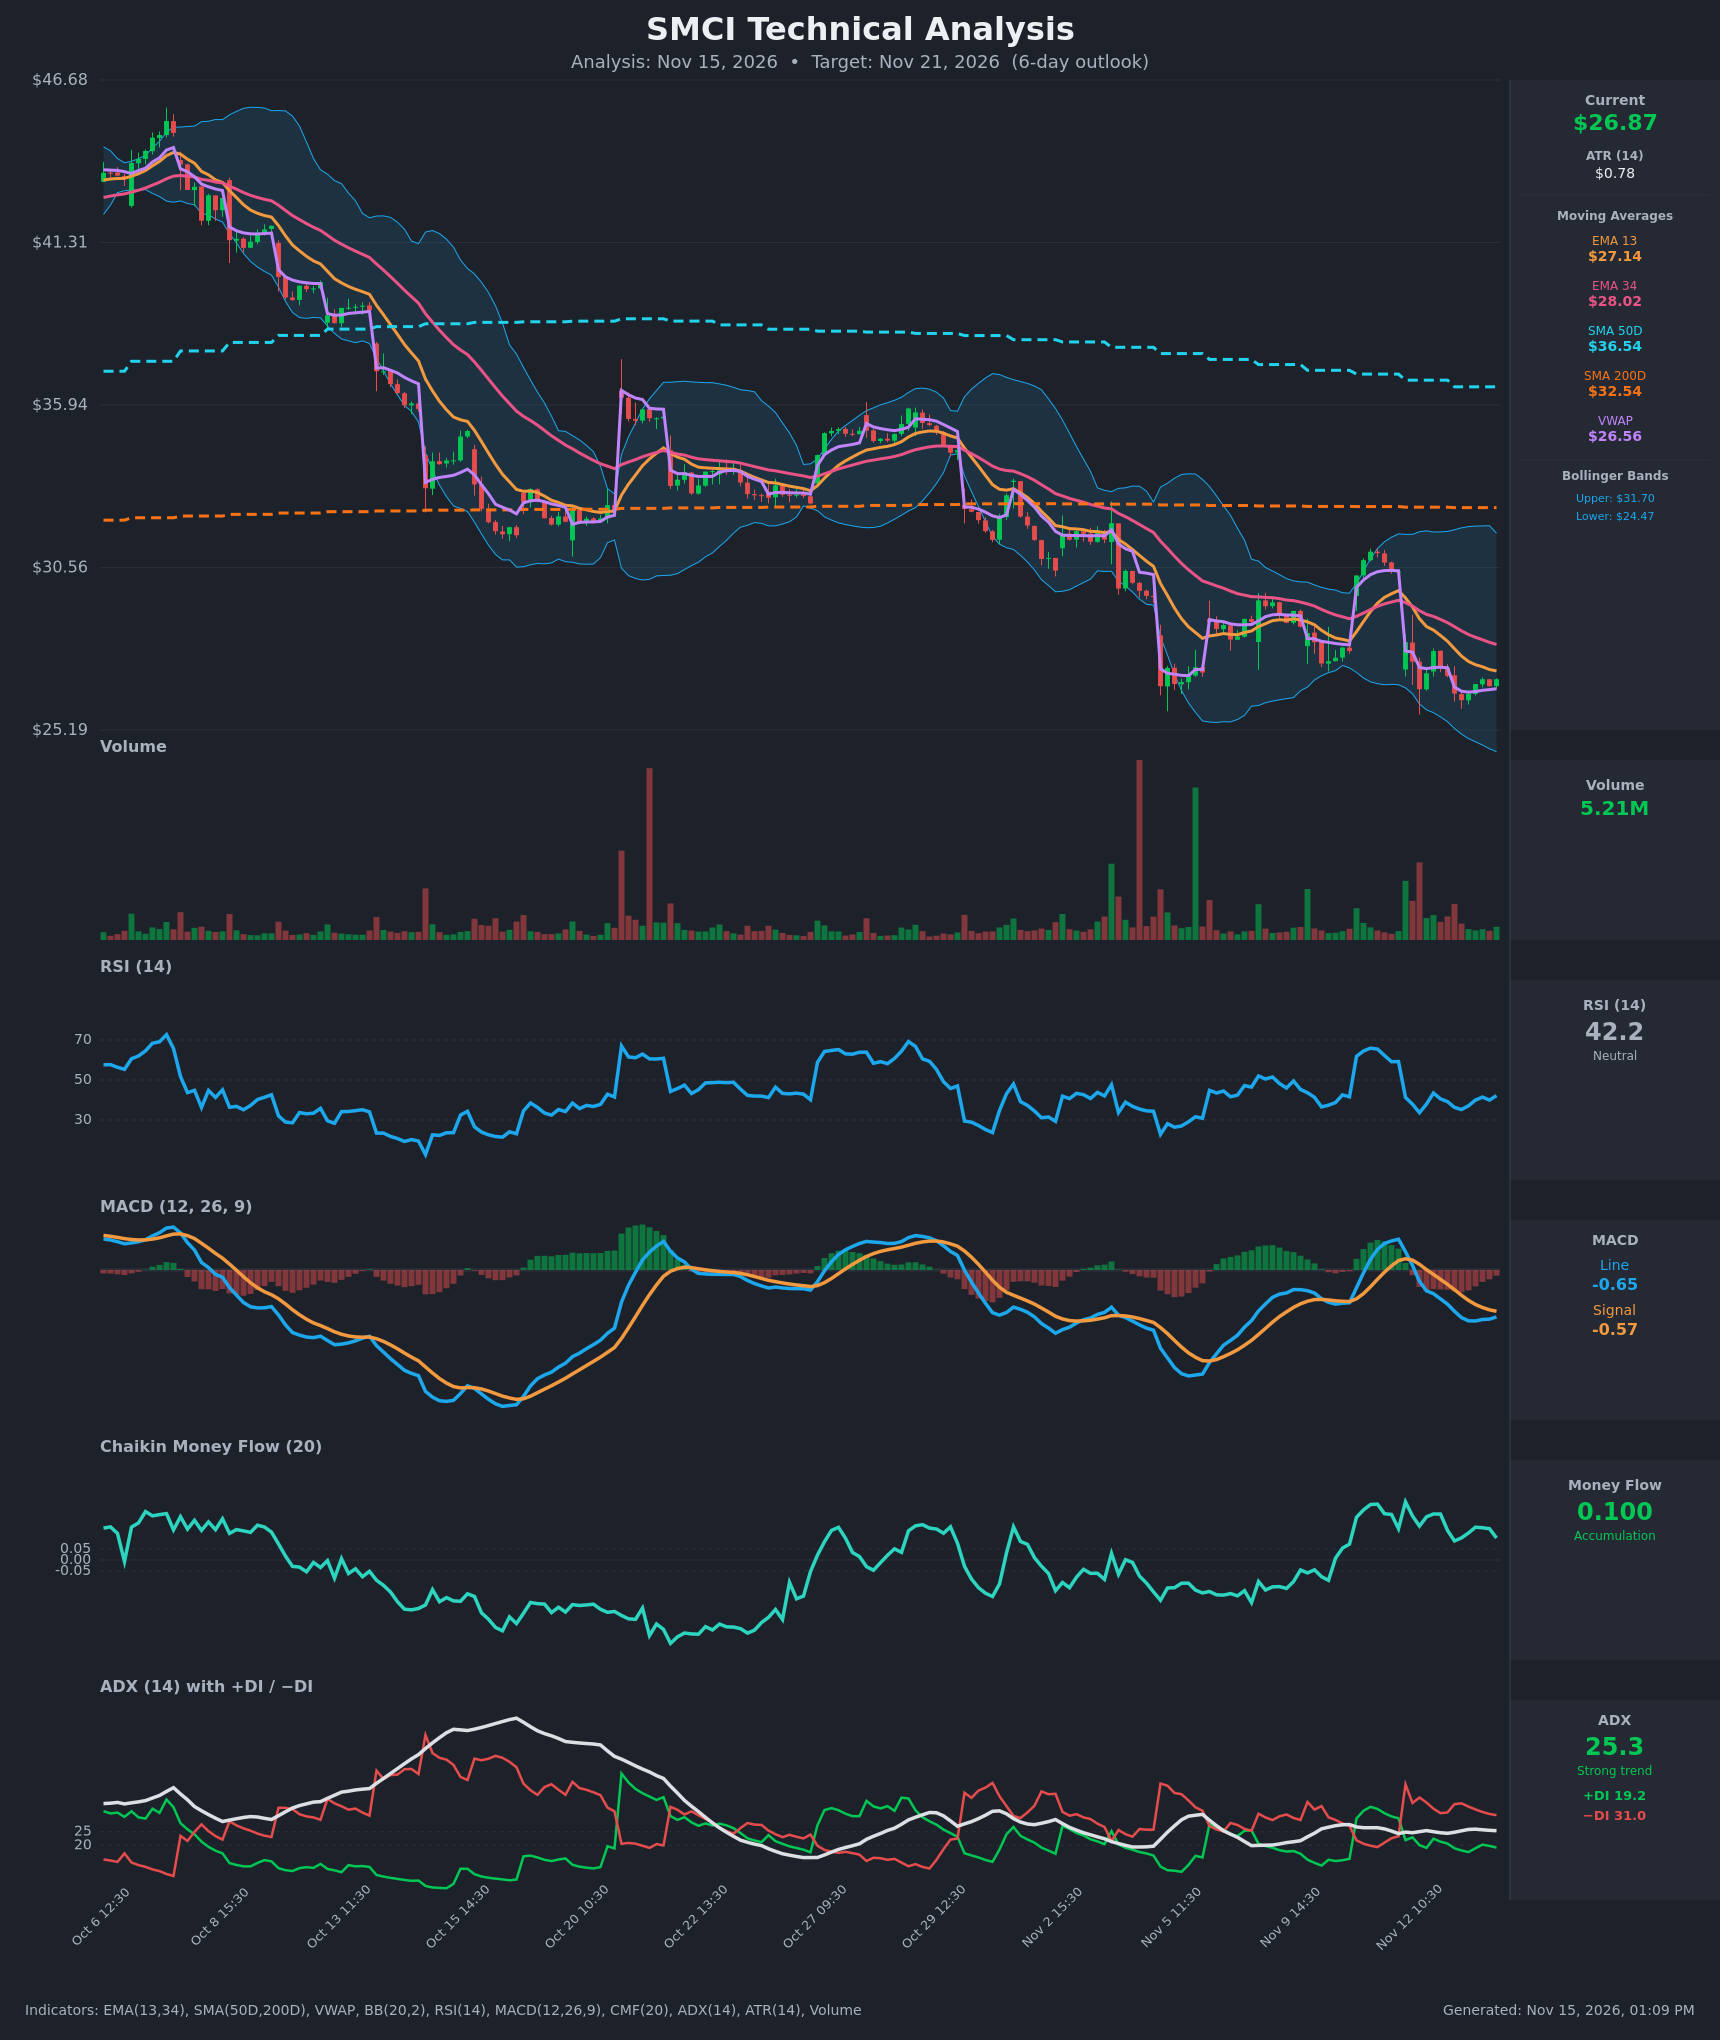
Analysis
TECHNICAL INDICATORS
- RSI (14): 42.19, below the 50 midline but above oversold. It bounced from 33.7 on Nov 12 and has been flat to slightly higher (35 to 42) over the last day. Momentum is weak but stabilizing. [Neutral]
- 20 EMA: The chart shows EMA 13 at $27.14 and EMA 34 at $28.02. Price at $26.87 is below both, and EMA 13 is below EMA 34 (bearish alignment since Nov 12). Both slope down and act as overhead resistance. [Bearish]
- MACD: Line -0.651 is below signal -0.572, a bearish crossover that occurred on Nov 12. The line is slightly recovering from -0.706, so the negative histogram is narrowing. Momentum is bearish but fading. [Bearish]
- Bollinger Bands (20): Upper $31.70, lower $24.47, midline about $28.08. Price is in the lower half, well below the midline, with room before the lower band. Bands are wide after recent volatility. [Bearish]
- CMF (20): 0.100, above +0.05 and sustained positive for several sessions (0.09 to 0.27). Buying is persisting despite the price decline, a mild divergence. [Accumulation]
- ADX (14): 25.3 with −DI 31.0 well above +DI 19.2. The trend is strong enough to count and the bears are in control. ADX has been flat around 25. [Strong Trend - Bearish]
- Volume: 5.21M, average to slightly below average, with no capitulation spike on the recent decline. Spikes earlier in the month at the Nov 5 and Nov 6 lows were followed by bounces. [Neutral / lacks conviction]
DIVERGENCES & TRENDS
- Price vs. CMF: Price is making lower lows while CMF holds positive near 0.10. This is a bullish divergence that hints at accumulation, but it has not yet shown up in price.
- Price vs. RSI: RSI's low (~34-35) is higher than the early-Nov low (~26), a mild bullish divergence in momentum, while price sits near the Nov 5 low zone around $25.5-26.
- Moving averages: Price is far below SMA200D ($32.54) and SMA50D ($36.54), and SMA50D is above SMA200D but falling toward it, so a death cross is a possibility. EMA13 is below EMA34 and both are falling. The long-term trend is clearly down.
- MACD: Line and signal are both below zero and the line is below the signal, so momentum is bearish. The turn in the line suggests selling pressure is easing.
- VWAP: Price at $26.87 is just above VWAP ($26.56), a minor intraday support.
- DI: −DI has been above +DI since Nov 12, confirming bearish control.
CHART PATTERNS
- The broad structure since early Oct is a long descending channel of lower highs and lower lows, resembling a Bearish Flag/Descending Channel on the larger timeframe. Rallies to ~$30.5 on Nov 6 and ~$33-35 earlier failed at falling EMAs.
- Over the past week, price has been consolidating between roughly $25.7 and $28, forming a small base. This could become a Bullish Falling Wedge or double bottom, but neither is confirmed. A break above the EMA13 (~$27.14), then ~$28, would be the first signal.
- Pattern implication: the dominant structure is a continuation-down. A measured move is unclear, but a break below ~$25.7 opens the lower Bollinger Band ($24.47).
POTENTIAL SCENARIOS
- Scenario 1: Bearish Continuation Lower — Price stays below the falling EMAs, with −DI dominant and MACD below signal, and drifts to retest the Nov 12-13 lows and the lower Bollinger Band. Trigger: Rejection at EMA13 (~$27.15) and a break below $26.18. Target: $25.00-$25.50. Invalidation: Close above $28.00. (50% probability)
- Scenario 2: Neutral Range Base — Price chops between support near $25.80 and resistance near $28 as accumulation (CMF) offsets bearish trend indicators. Trigger: Holding $26.00 with low volume. Target: $26.50-$27.50. Invalidation: Break out of $25.70-$28.00. (20% probability)
- Scenario 3: Bullish Relief Bounce — Positive CMF and the RSI higher low drive a bounce to the EMA34 and midline. Trigger: Close above $27.15 and then $28.00 with rising volume. Target: $28.00-$28.80. Invalidation: Close below $26.00. (30% probability)
PRICE TARGETS
For the 6-day timeframe (to Nov 21, 2026), ATR is $0.78, so the typical daily move is about 2.9% and the 6-day standard deviation is near $1.9.
- Target Price: $26.20 (modestly below the current price, reflecting the bearish trend and overhead EMA resistance)
- Expected Range: $24.30 to $28.30 (width $4.00, about 14.9% of price; this is wide for a 6-day horizon but fits the current volatility and ATR, and sits within the 7-10 day guidance range, scaled for 6 days)
- Key Levels: Support at $25.70, Resistance at $27.14
Self-check: The range width is $4.00, or ~14.9% of $26.87. The standard 6-day guidance is 4-8%, so the range is wider than guided, but the ATR-based volatility justifies it. A tighter range of $24.80 to $28.00 (about 11.9%) would still be wider than the guideline, so I keep the range tied to ATR.
OVERALL BIAS
OVERALL BIAS: BEARISH - Price is below both falling EMAs and the SMA200D, MACD is below its signal, and −DI (31.0) dominates +DI (19.2) with ADX at 25. Positive CMF and the higher RSI low temper the downside, so the target is modest at $26.20.
This is educational analysis and not financial advice.