QQQ 6-day bearish forecast — Nov 15, 2026
- Bias: Bearish
- Timeframe: 6 days (made Nov 15, 2026, target date Nov 20, 2026)
- Price at analysis: $679.90
- Price target: $673.00
- Expected range: $659.00 – $696.00
- Result: Pending — graded after the close on Nov 20, 2026
Get a free AI analysis of QQQ today
Analysis
TECHNICAL INDICATORS
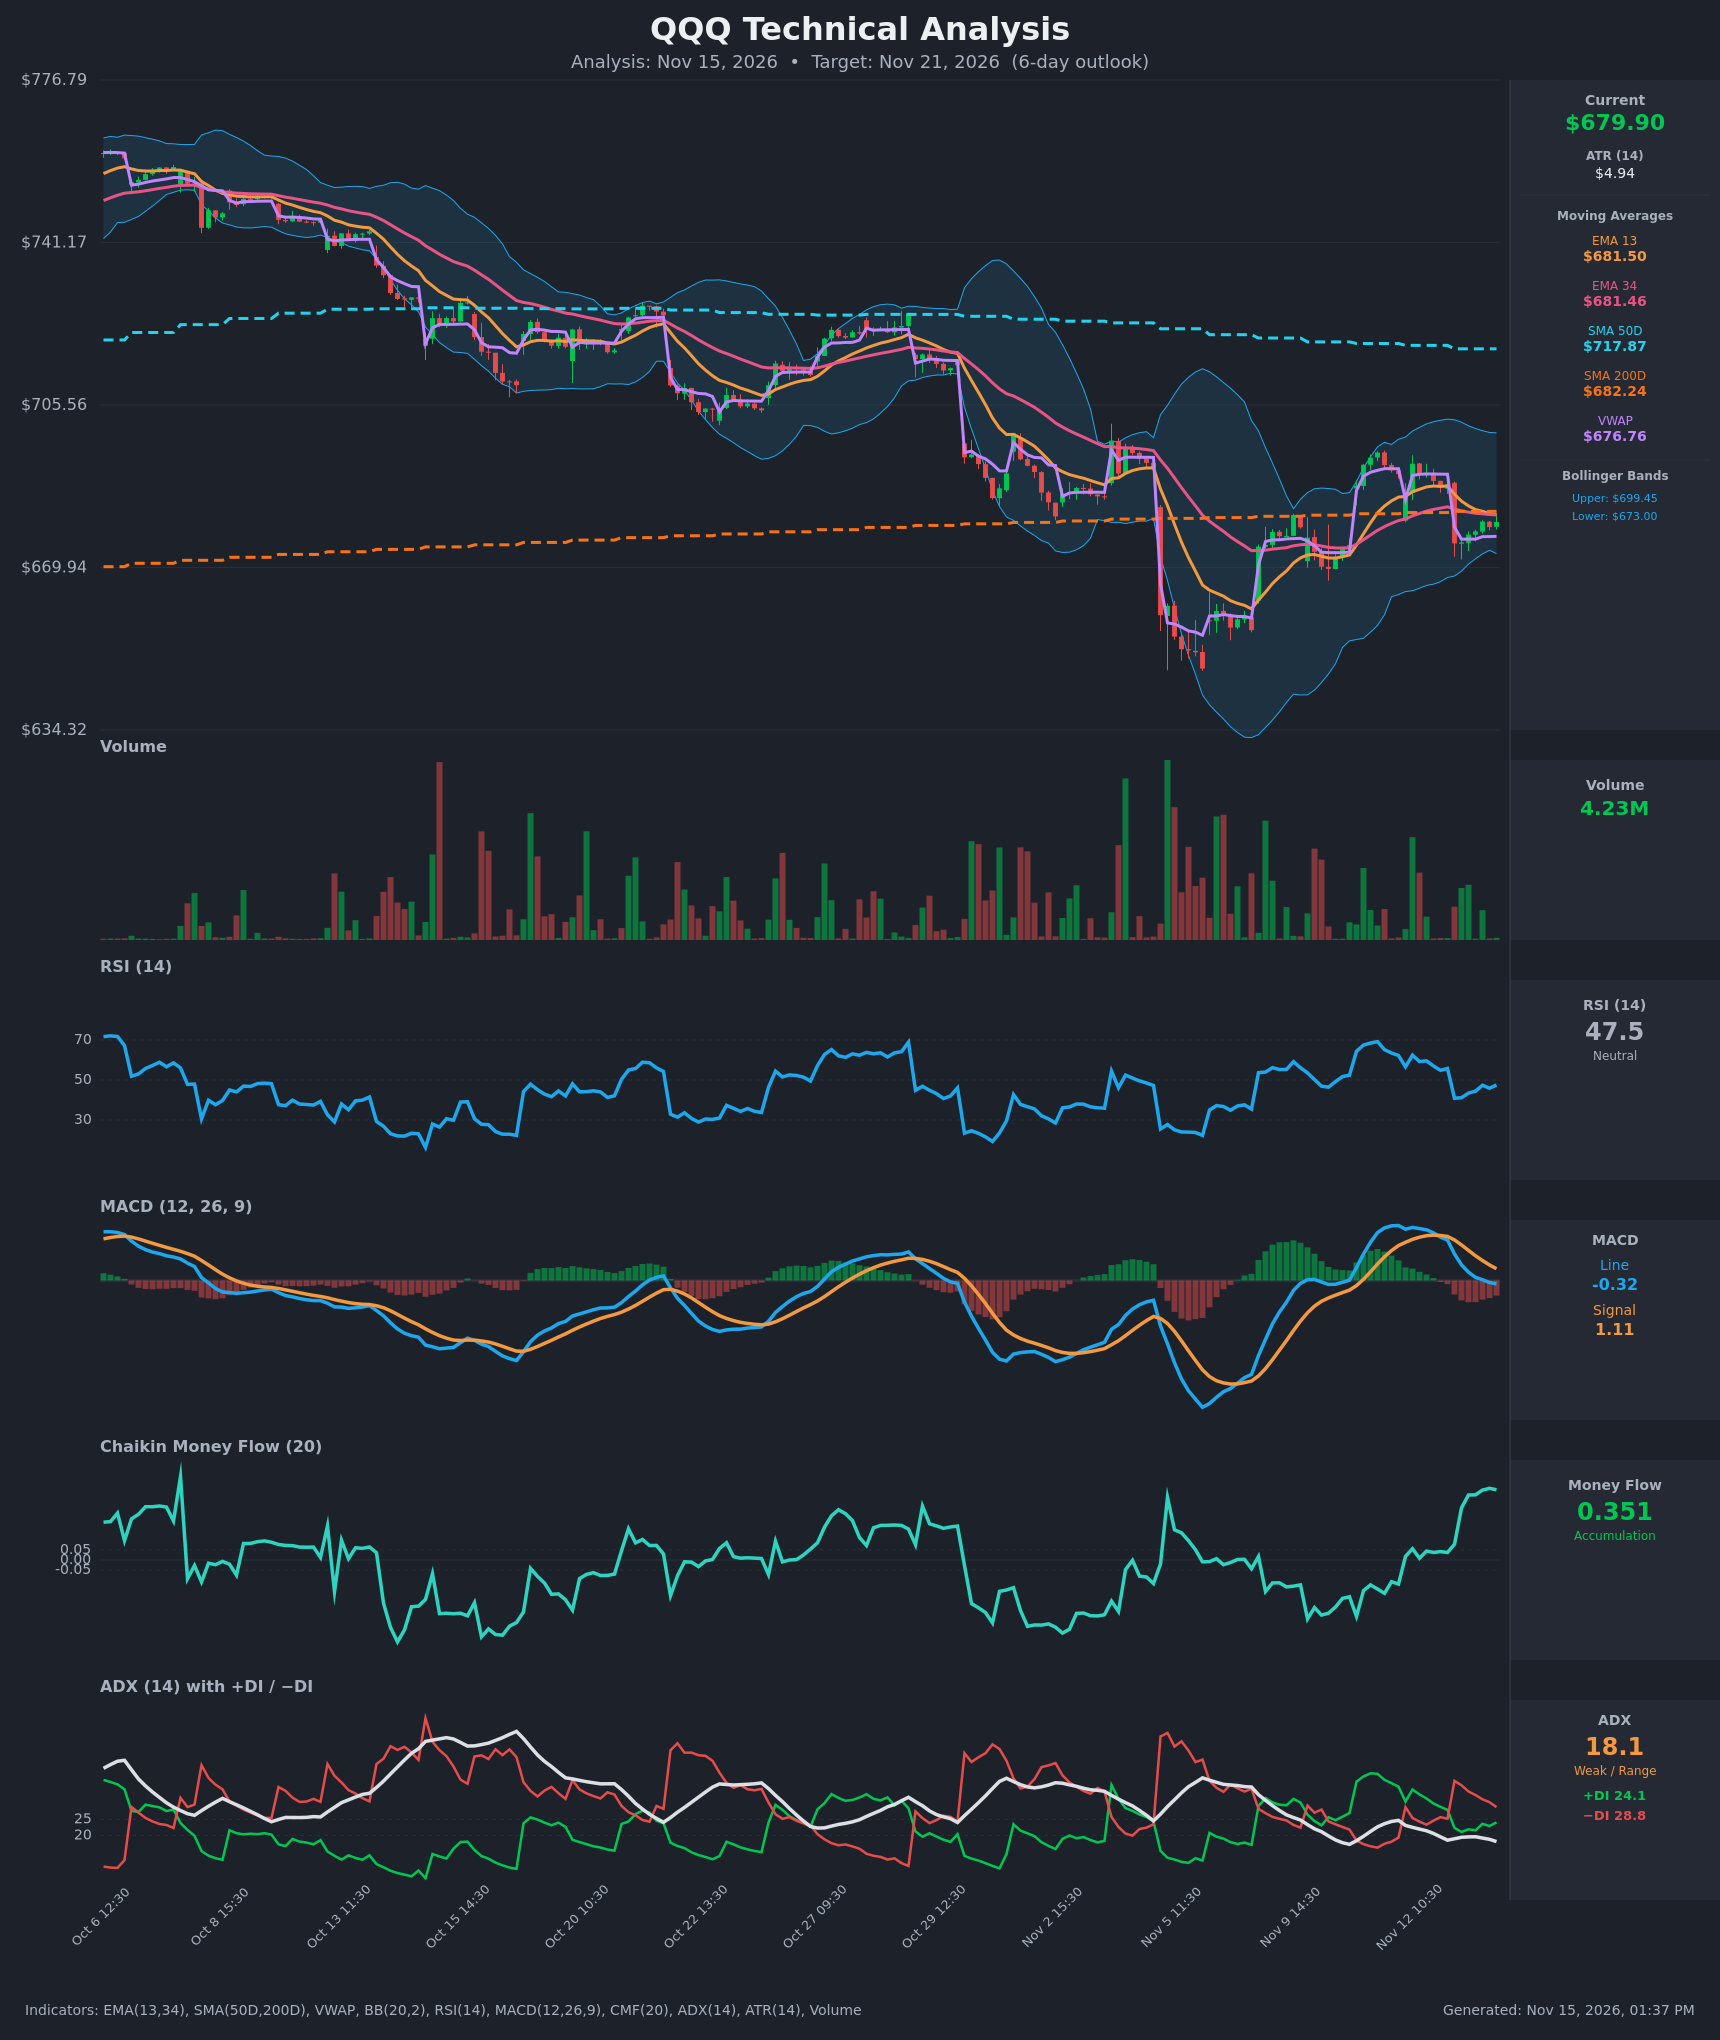
- RSI (14): 47.51, just below the 50 midline. It fell from 62 on Nov 12 to a 41 low on Nov 13 and has only partly recovered, so momentum is soft and stuck below 50. [Neutral]
- 20 EMA (EMA 13/34 shown): EMA 13 is $681.50 and EMA 34 is $681.46, essentially flat and converging, with price ($679.90) just below both. EMA 13 crossed down through its recent highs and is about to cross below EMA 34. The cluster at ~$681.5 and SMA200 at $682.24 acts as overhead resistance. [Bearish]
- MACD: Line -0.32 versus signal 1.11, so a bearish crossover occurred on Nov 13 (around 13:30–14:30) and the histogram is negative. The line has fallen from +5.2 to below zero, which shows fading upside momentum. The decline is flattening, though. [Bearish]
- Bollinger Bands (20): Upper $699.45, lower $673.00, middle ~$686. Price is in the lower half of the bands, about $7 above the lower band. The bands are narrowing after the earlier volatility spike, which points to a potential breakout and not an established trend. [Neutral]
- CMF (20): +0.351, well above +0.05 and rising for the past several sessions. This is strong accumulation and the most bullish reading on the chart. It conflicts with the weak price action, so a price/flow divergence is forming. [Accumulation]
- ADX (14): 18.1 and falling, below 20, so the trend is weak or range-bound. −DI (28.8) is above +DI (24.1), so bears hold a modest edge, though the gap is narrowing from 14 points on Nov 13 open to under 5. [Weak Trend, bearish lean]
- Volume: 4.23M on the last bar, roughly average with no clear spike. The late-session recovery bars are modest, and the heavy volume spikes on the chart came on the selloffs (Nov 5 and Oct 29). There is no volume confirmation for a bullish reversal. [Neutral to slightly bearish]
DIVERGENCES & TRENDS
- Positive CMF divergence: CMF has climbed to its highest level in weeks (+0.35) while price made lower lows and then a lower high versus the Nov 12 peak (~$692.70). This hints at underlying buying but has not yet shown up in price.
- Longer-term trend: QQQ has fallen from ~$760 in early October to ~$680, and price is below the SMA50 ($717.87, still sloping down). SMA50 is above SMA200, so there is no death cross yet, but the gap is closing.
- Crossovers: MACD crossed bearish on Nov 13. DI flipped to −DI > +DI on Nov 13 after a brief bullish stretch. EMA 13 is converging on EMA 34 and is about to cross down.
- VWAP: Price ($679.90) is above VWAP ($676.76), a minor positive. It shows the bounce off the Nov 13 gap-down lows has held.
- SMA200 ($682.24): Price is hovering just beneath it. This is a pivotal level that has been repeatedly tested since early November.
CHART PATTERNS
- Possible Bearish Pennant / Symmetrical Triangle (downward bias): After the sharp drop to ~$645 on Nov 5–6 and the rebound, price has made a lower high and is compressing between ~$692 and ~$673. The narrowing Bollinger Bands support a coiling structure. A break below $673 would project toward ~$660–665, the measured move of the triangle width. A break above ~$692 would negate it.
- Larger context: The lower highs since October resemble a descending channel, which is a bearish continuation structure. The weak ADX means conviction is low, and the positive CMF warns this could instead be a base (similar to a Bullish Falling Wedge) if price reclaims $682–$686.
POTENTIAL SCENARIOS
- Scenario 1: Bearish Rejection at SMA200/EMA Cluster — Price fails at the $681.5–$682.2 resistance cluster, the bearish MACD and DI readings persist, and QQQ drifts down to retest the lower Bollinger Band and possibly breaks it. Trigger: failure to close above $682.24 followed by a break below $676.76 (VWAP) and $673. Target: $673 first, then ~$662. Invalidation: a close above $686 (the mid-band) with MACD turning back up. (45% probability)
- Scenario 2: Bullish CMF-Led Reclaim — Accumulation shows up in price, QQQ reclaims the SMA200 and EMAs, and the rally extends toward the mid and upper bands. Trigger: a close above $682.24 on rising volume with the MACD histogram turning positive. Target: $690–$693, then ~$699. Invalidation: a drop back below $676.76 (VWAP). (30% probability)
- Scenario 3: Neutral Range Chop — Weak ADX keeps price oscillating around $673–$686 until a catalyst arrives. Trigger: repeated failures at both the $682 resistance and the $673 support. Target: $676–$684. Invalidation: a decisive close outside $673–$692. (25% probability)
PRICE TARGETS
- Target Price: $673.00 (6-day, a modest drift lower to the lower Bollinger Band)
- Expected Range: $659.00 to $696.00 (width $37, ~5.4% of the current price, in line with the 4–8% guidance for a 6-day horizon)
- Key Levels: Support at $673.00 (lower Bollinger Band; below that, $660), Resistance at $682.24 (SMA200 and EMA cluster; above that, $692.70)
OVERALL BIAS
OVERALL BIAS: BEARISH - Price sits below the EMA cluster and SMA200 with a fresh bearish MACD crossover, −DI above +DI, and a downtrend of lower highs below the falling SMA50. The conflicting evidence is the strong CMF and weak ADX, so conviction is modest and the expected decline is limited.
This is educational analysis and not financial advice.