QQQ 4-day bearish forecast — Nov 15, 2026
- Bias: Bearish
- Timeframe: 4 days (made Nov 15, 2026, target date Nov 18, 2026)
- Price at analysis: $679.90
- Price target: $674.50
- Expected range: $662.00 – $692.00
- Result: Pending — graded after the close on Nov 18, 2026
Get a free AI analysis of QQQ today
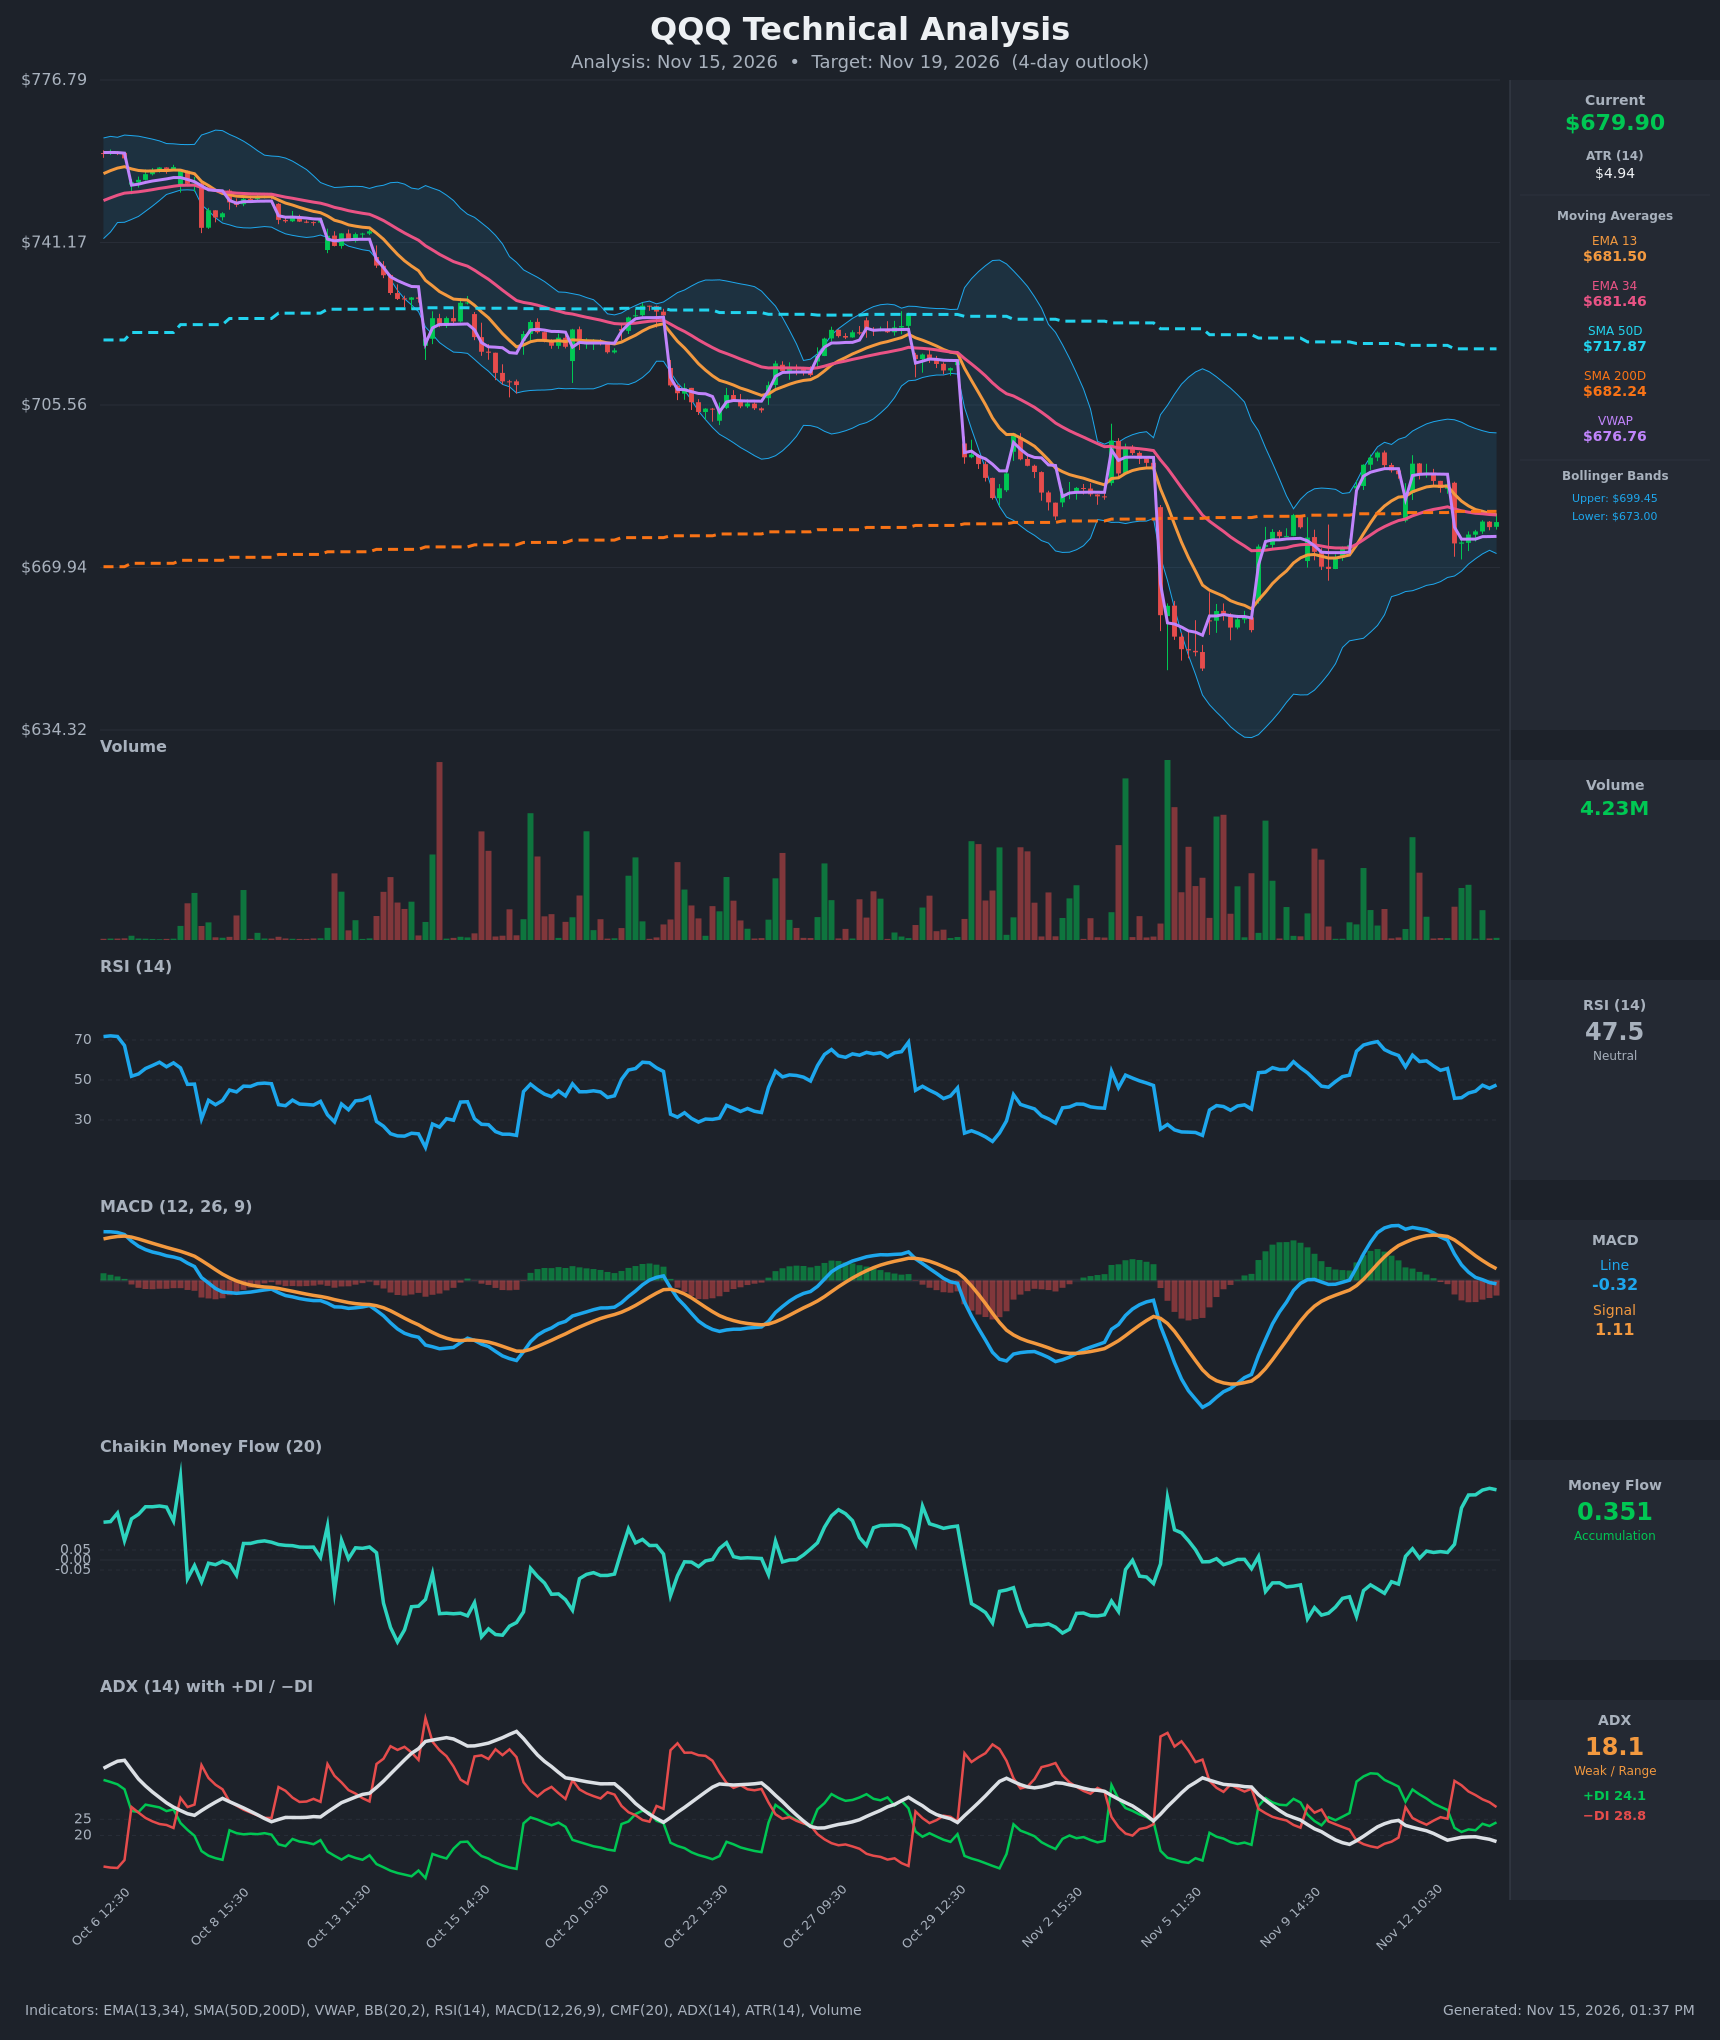
Analysis
TECHNICAL INDICATORS
- RSI (14): 47.51, neutral, bouncing slightly from ~41 on Nov 13 but still below 50. It fell from the low 60s on Nov 12, so momentum has rolled over and only partly recovered. [Neutral]
- 20 EMA: The chart shows EMA 13/34 instead. EMA 13 is $681.50 and EMA 34 is $681.46, and the two are essentially flat and converging, with EMA 13 about to cross below EMA 34. Price at $679.90 is just below both, so the cluster at ~$681.5 is overhead resistance. SMA200D at $682.24 sits just above too, and SMA50D at $717.87 is far above and still falling. [Bearish]
- MACD: Line -0.32, signal +1.11, so the line crossed below the signal around Nov 13 and has turned negative. The histogram is negative and still widening slightly, which shows fading momentum and a bearish crossover. [Bearish]
- Bollinger Bands (20): Upper $699.45, lower $673.00, midline ~$686. Price sits in the lower half, ~$7 above the lower band. The bands are narrowing after the big expansion in early November, which points to a volatility squeeze with a breakout coming. The lower band at $673 is the nearest test. [Neutral]
- CMF (20): +0.351, well above +0.05 and rising steadily over the last several sessions. This is clear accumulation, the strongest bullish signal on the chart, though price has not yet followed it. [Accumulation]
- ADX (14): 18.1 and falling, so the trend is weak or range-bound. −DI (28.8) is above +DI (24.1), which gives bears a mild edge, but the gap is narrowing from the 37/22 spread on Nov 13. [Weak Trend, slight bearish tilt]
- Volume: 4.23M, modest and below the spikes seen on the early-November selloff and rebound. The recent bounce came on light volume, so there is no strong conviction in either direction. Price is above VWAP ($676.76), a small intraday positive. [Neutral / Low conviction]
DIVERGENCES & TRENDS
- CMF vs price: CMF has risen from about -0.1 to +0.35 while price has gone sideways to lower. This is a bullish divergence (accumulation under the surface), but it needs price confirmation above ~$682–686.
- MACD vs price: MACD made a lower high near the Nov 12 bounce. It rolled over and crossed down while price dropped from $692 to $675, so the momentum signal is bearish.
- Trend structure: The larger trend is still down, with lower highs from ~$760 to ~$698 to ~$692. SMA50D is falling and far above price, and price is stuck around SMA200D ($682.24), which has been acting as a pivot.
- Crossovers and breaks:
- EMA 13 and EMA 34 are converging, with a bearish cross imminent.
- A bearish MACD signal cross has just occurred.
- −DI has stayed above +DI since Nov 13.
- Price is slightly below SMA200D (a marginal break) but above VWAP.
- Intraday gap: Nov 13 opened with a gap down from $688 to $675, and the partial retracement since then has been slow.
CHART PATTERNS
- Bearish Flag / Bearish Pennant (continuation): After the sharp drop from the Nov 12 high (~$692) to ~$675, price has formed a small, tightening, upward-drifting consolidation under the EMA/SMA200 cluster. A break below ~$673–675 would project roughly $10–15 lower, toward $662–665.
- Symmetrical Triangle (the narrowing Bollinger Bands support this): Lower highs and a higher low near $673–675 are squeezing price, and the breakout direction is undecided. The bearish tilt comes from the prevailing downtrend and −DI dominance. An upside break above ~$686 would negate it and target ~$692–699.
- Bearish Rising Wedge: The rebound from the early-November low (~$650) has a wedge-like shape, which adds mild downside risk.
POTENTIAL SCENARIOS
- Scenario 1: Bearish Flag Breakdown — Price fails at the $681.5–682.2 resistance cluster (EMA 13/34 and SMA200D), the MACD stays negative and −DI stays on top, and price breaks the $673 lower Bollinger Band. Trigger: hourly close below $673. Target: $664–668. Invalidation: close back above $686. (45% probability)
- Scenario 2: Neutral Squeeze Chop — Price oscillates between $673 and $685 as the squeeze continues and ADX stays below 20. Trigger: no decisive close outside $673–$685. Target: $676–$682. Invalidation: a hourly close outside the $673–$686 band. (30% probability)
- Scenario 3: Bullish Reclaim on Accumulation — Strong CMF accumulation finally lifts price above the EMA/SMA200 cluster, which would also clear the midline. Trigger: hourly close above $686 on rising volume. Target: $692–$698 (prior high and upper band). Invalidation: close below $675. (25% probability)
PRICE TARGETS
- Target Price: $674.50 (4-day horizon)
- Expected Range: $662.00 to $692.00 (width $30 ≈ 4.4% of current price, which fits the 3–7 day scaling)
- Key Levels: Support at $673.00, Resistance at $682.24
OVERALL BIAS
OVERALL BIAS: BEARISH - Price is stuck beneath the converging EMA 13/34 and SMA200D cluster, MACD has crossed down, and −DI is above +DI within a still-intact lower-high downtrend. The strong CMF accumulation is a real counterweight, so conviction is modest and a break above $686 would flip the picture.
This is educational analysis and not financial advice.