TLT 4-day bearish forecast — Nov 15, 2026
- Bias: Bearish
- Timeframe: 4 days (made Nov 15, 2026, target date Nov 18, 2026)
- Price at analysis: $79.37
- Price target: $78.90
- Expected range: $77.80 – $80.60
- Result: Pending — graded after the close on Nov 18, 2026
Get a free AI analysis of TLT today
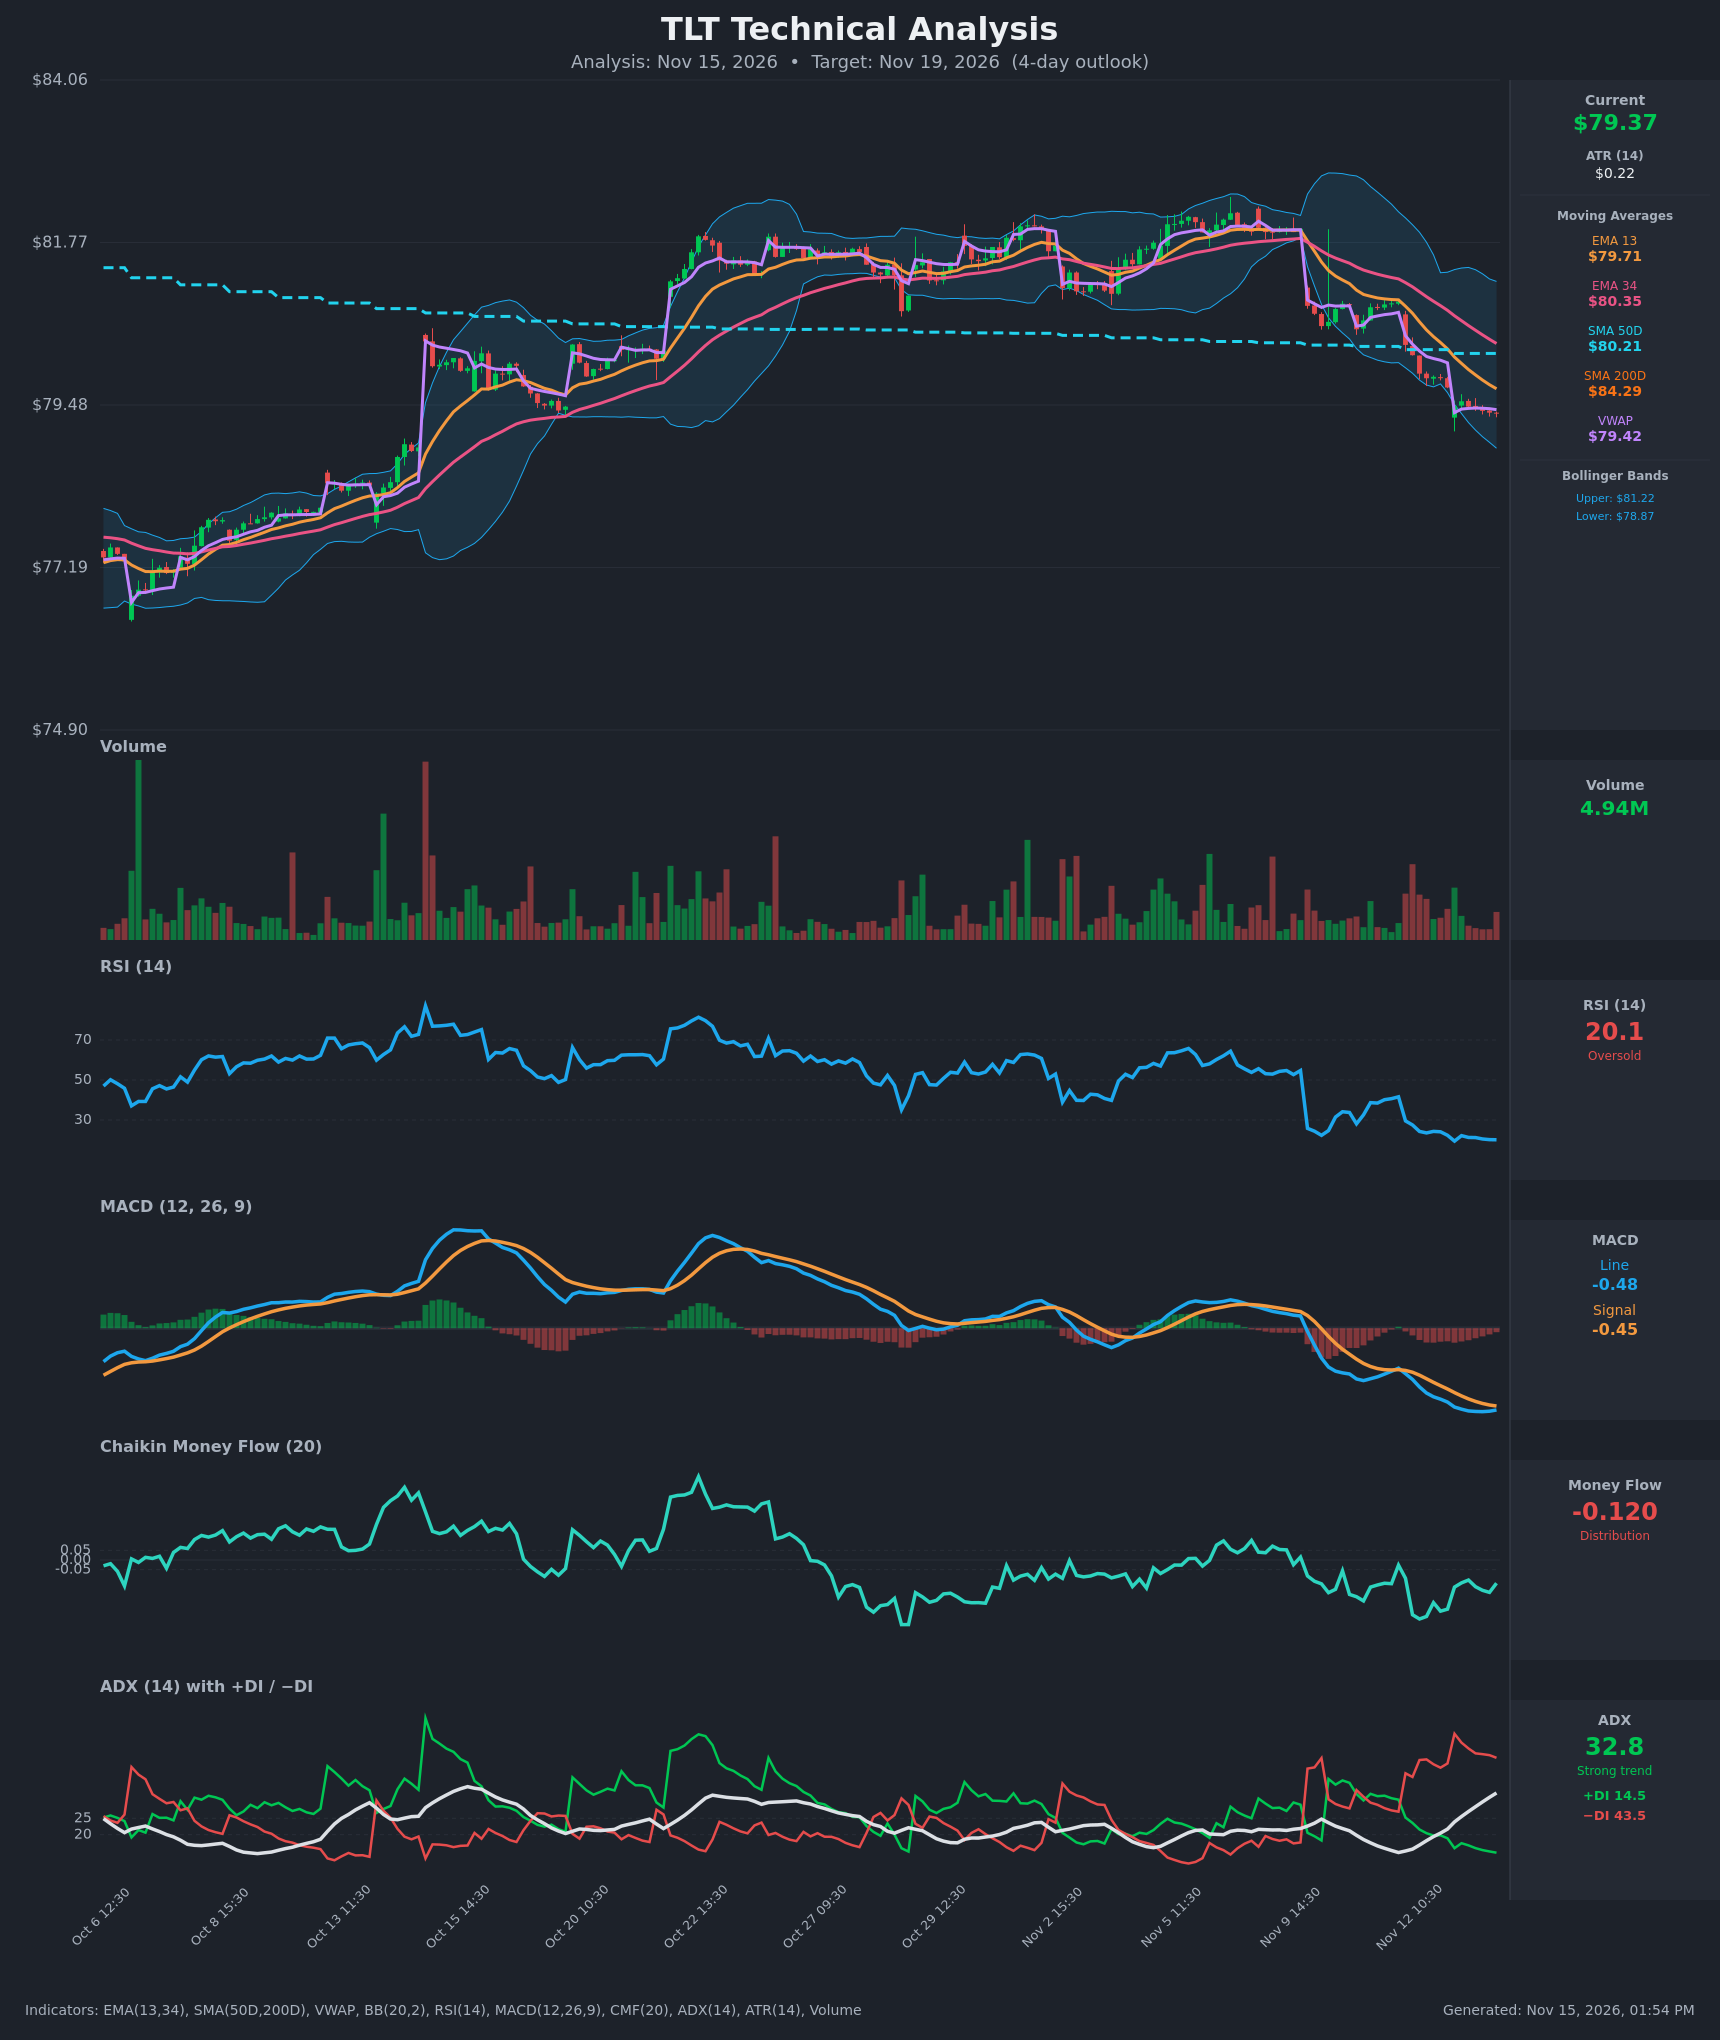
Analysis
TECHNICAL INDICATORS
- RSI (14): 20.11, deeply oversold after falling from the low 40s and 29.6 on Nov 12. It has been below 25 for most of the last two sessions and is flat near 20, so downside momentum is stalling but there is no bullish divergence yet. Oversold readings in a strong downtrend can persist, though the bounce risk is high. [Bearish (stretched, bounce risk)]
- 20 EMA: The supplied EMA 13 is $79.71 and EMA 34 is $80.35. Price at $79.37 is below both, and EMA13 is below EMA34 with the gap widening. The EMAs slope down and act as overhead resistance. [Bearish]
- MACD: Line -0.476, signal -0.453, histogram about -0.023. The line crossed below the signal on Nov 12 and both are falling. The histogram has narrowed from -0.05 as the line flattens (-0.486 to -0.476), an early sign of momentum deceleration. It is still a bearish configuration. [Bearish]
- Bollinger Bands (20): Upper $81.22, lower $78.87, so the bands are wide after the selloff. Price at $79.37 is in the lower quarter of the bands, about $0.50 above the lower band. It rode the lower band during the Nov 13 gap-down and has since stopped making new lows. [Bearish]
- CMF (20): -0.120, below the -0.05 threshold. It has been negative for weeks, with a brief dip to -0.30 on Nov 12, and has only partially recovered. This shows persistent distribution. [Distribution]
- ADX (14): 32.8 and rising steadily (14.5 to 32.8 in two sessions), above 25. −DI at 43.5 is far above +DI at 14.5, so bears are firmly in control and the trend is accelerating. [Strong Trend – Bearish]
- Volume: 4.94M, unremarkable compared with the spikes on earlier rallies. The selloff was a gap-and-drift with no capitulation volume, so there is no sign of a washout bottom yet. Price is also slightly below VWAP ($79.42). [Neutral-to-Bearish; no capitulation]
DIVERGENCES & TRENDS
- There is no bullish RSI or MACD divergence. RSI and MACD both made new lows with price, which confirms the downtrend.
- Price is below EMA13, EMA34, SMA50 ($80.21) and SMA200 ($84.29). SMA50 is below SMA200, a long-standing death-cross configuration.
- Price lost the $80.2–$80.3 area (SMA50 and prior range support) on Nov 12–13, and that zone is now resistance.
- EMA13 crossed below EMA34 during the decline, and MACD crossed below its signal. ADX is trending up with −DI dominant.
- Early stabilization: MACD histogram contraction and a tight sideways drift near $79.4 over the last 6 hourly bars. Price is also slightly below VWAP, so sellers still hold the intraday edge.
CHART PATTERNS
- Bearish Pennant / Bearish Flag (continuation): After the sharp drop from about $81.7 to about $79.4, price is consolidating in a tight, slightly declining range just above the lower Bollinger Band. A break below roughly $79.30 would trigger the pattern. The full measured move (about $2.3 of pole) points toward $77, but that is more than a 4-day move, so only part of it is likely within this window.
- The Bearish Head and Shoulders / lower-high structure from the Nov 5–9 peak confirms a distribution top and a shift into a downtrend.
- A Bullish Falling Wedge / Double Bottom is not visible. An oversold bounce would be only a counter-trend relief move.
POTENTIAL SCENARIOS
- Scenario 1: Bearish Continuation Lower — The pennant resolves down, with −DI dominance and rising ADX pulling price toward the lower Bollinger Band and slightly beyond. Trigger: a hourly close below $79.20. Target: $78.50–$78.90. Invalidation: a close back above $79.71 (EMA13). (50% probability)
- Scenario 2: Bullish Oversold Bounce — RSI near 20 and a narrowing MACD histogram prompt a mean-reversion bounce toward the EMAs. Trigger: a break above $79.71 with a rising RSI. Target: $80.20–$80.35 (SMA50 and EMA34 resistance). Invalidation: failure at $80.2 and a roll over, or a close below $78.87. (33% probability)
- Scenario 3: Neutral Sideways Digestion — Price chops between the lower band and EMA13 as momentum resets. Trigger: hourly closes held between $79.00 and $79.70. Target: $79.30–$79.50. Invalidation: a break of either boundary on volume. (17% probability)
PRICE TARGETS
- Target Price: $78.90 (4-day horizon)
- Expected Range: $77.80 to $80.60. Width is $2.80, or about 3.5% of the current price, which fits the 4-day timeframe guidance.
- Key Levels: Support at $78.87 (lower Bollinger Band), Resistance at $79.71 (EMA13; $80.21 SMA50 is the next level above)
OVERALL BIAS
OVERALL BIAS: BEARISH - Price is below all key moving averages, ADX is rising at 32.8 with −DI far above +DI, MACD sits below its signal, and CMF shows distribution. The tight consolidation just above the lower band looks like a bearish pennant. An RSI near 20 raises the risk of a relief bounce, so conviction is moderate.
This is educational analysis and not financial advice.