TLT 6-day bearish forecast — Nov 15, 2026
- Bias: Bearish
- Timeframe: 6 days (made Nov 15, 2026, target date Nov 20, 2026)
- Price at analysis: $79.37
- Price target: $78.80
- Expected range: $77.00 – $81.00
- Result: Pending — graded after the close on Nov 20, 2026
Get a free AI analysis of TLT today
Analysis
TECHNICAL INDICATORS
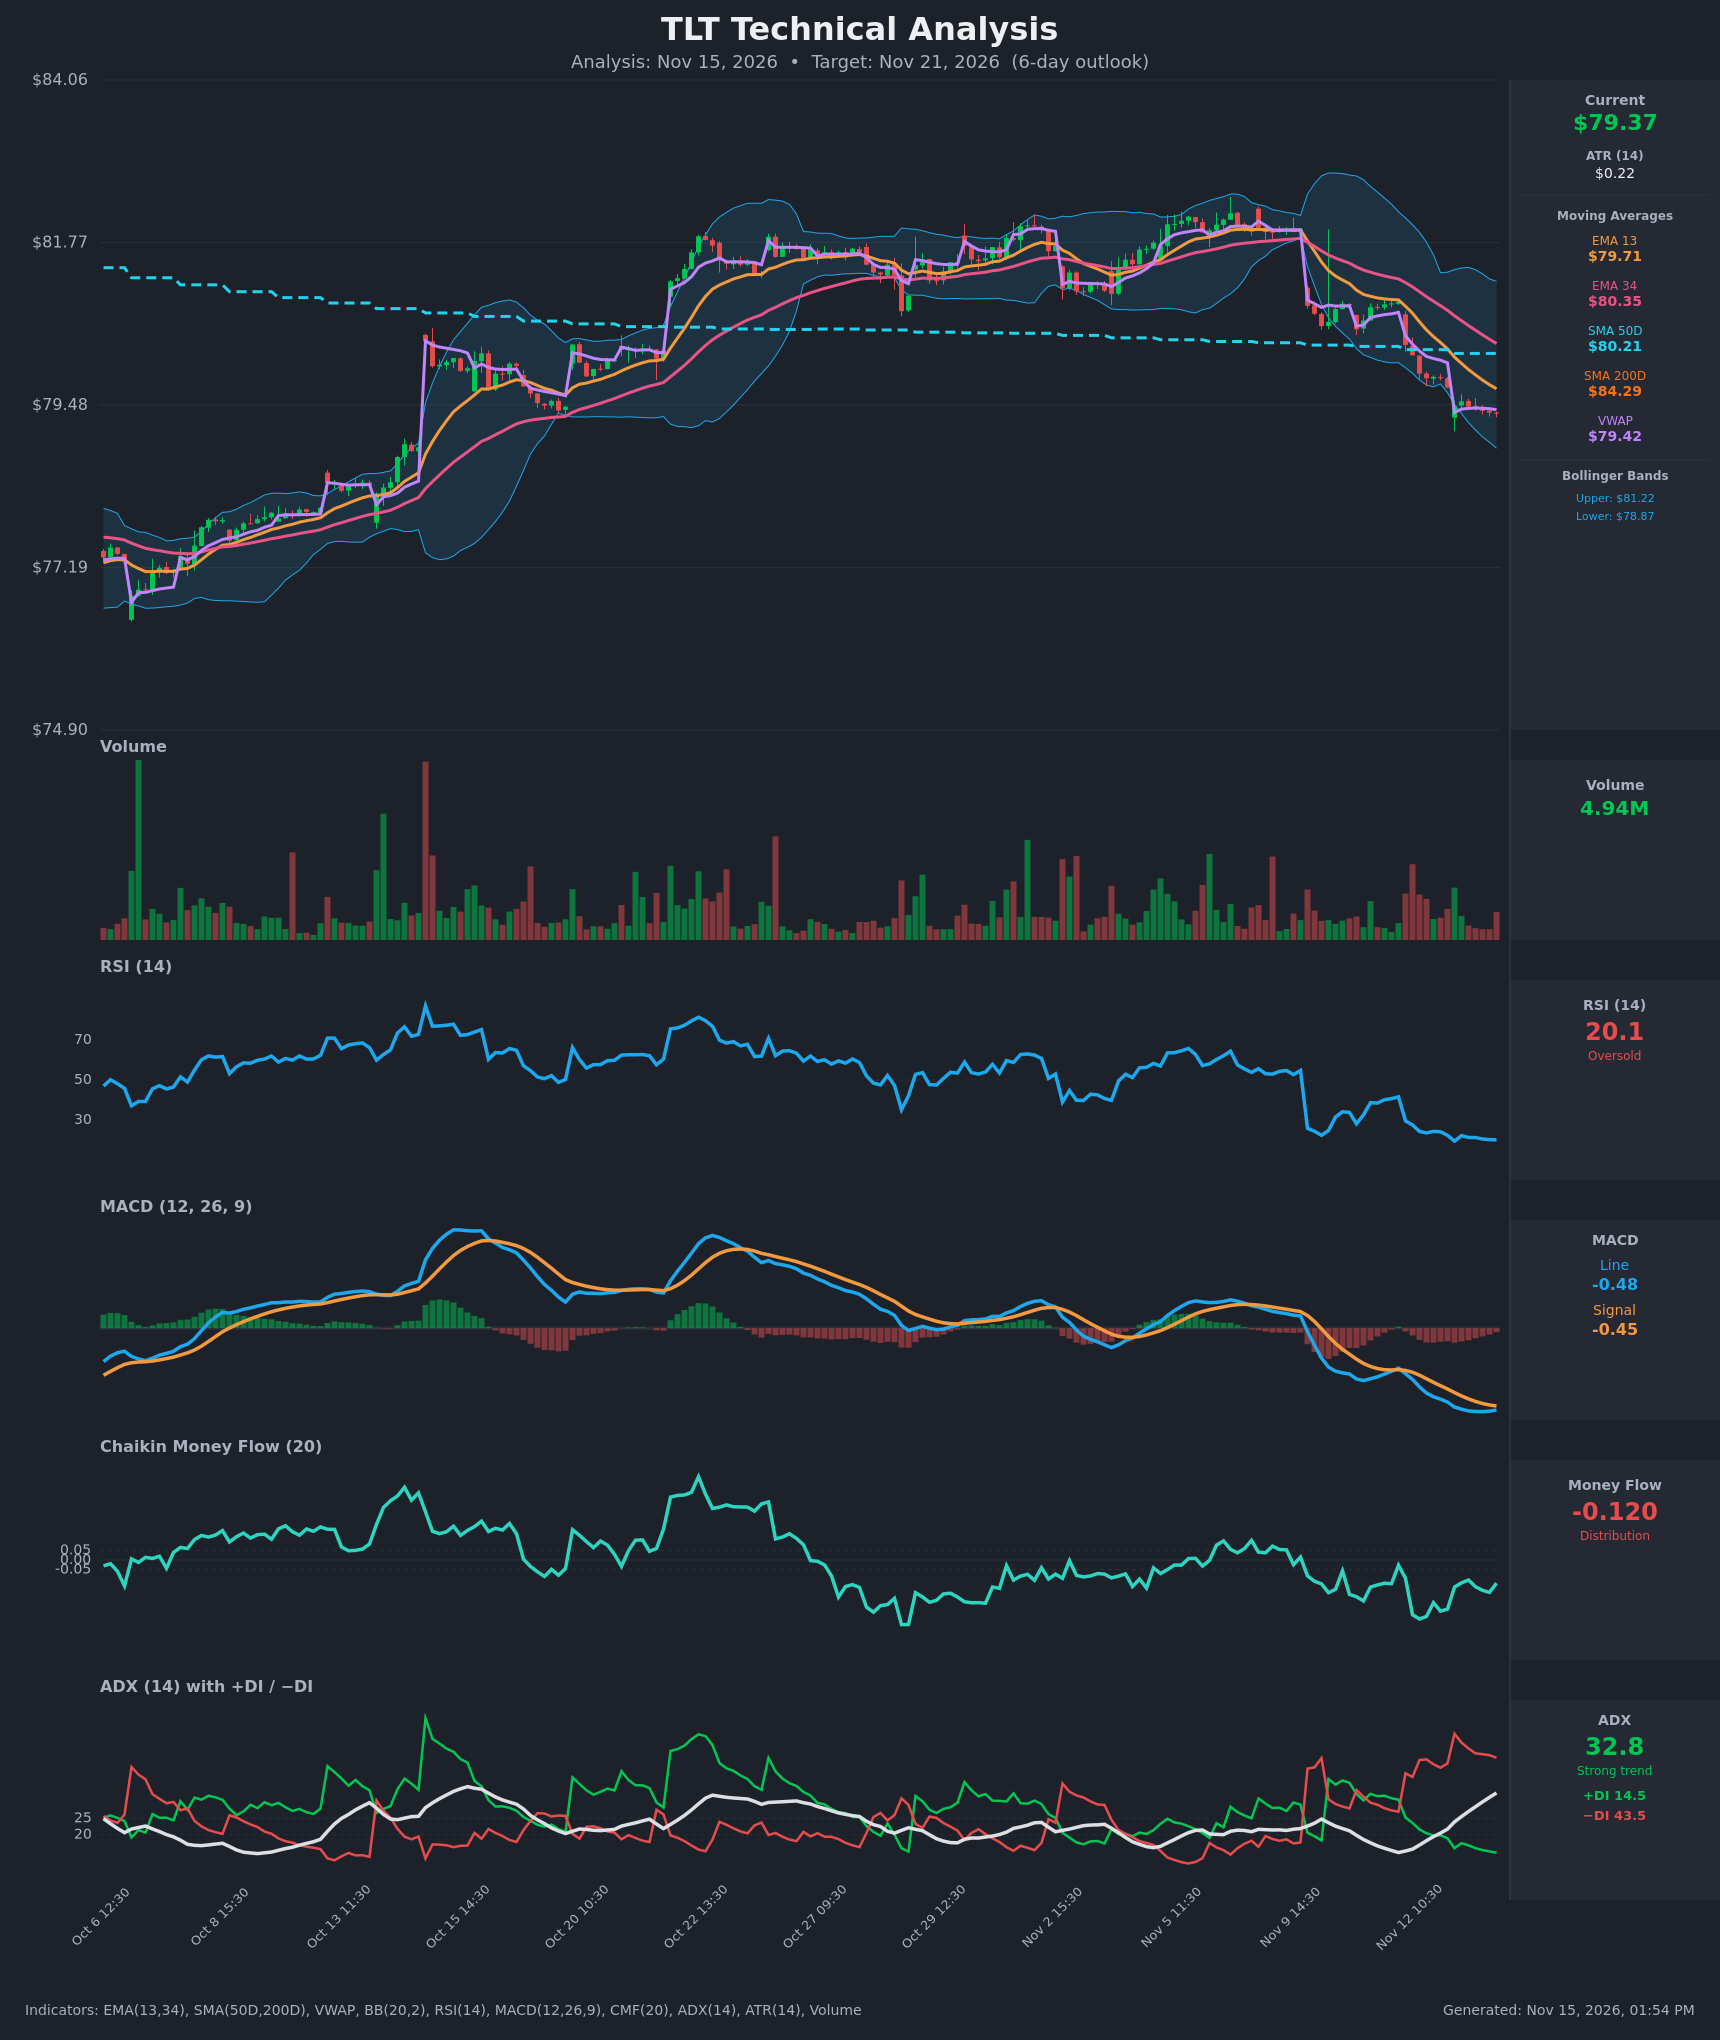
- RSI (14): 20.11, deeply oversold. It broke from the 50s to about 30 on the Nov 12 gap-down and has since made marginally lower lows (19.4 to 20.1). Momentum is still weak, but selling is stretched and a relief bounce is possible. [Bearish] (oversold caveat)
- 20 EMA: The chart shows EMA 13 ($79.71) and EMA 34 ($80.35). Price at $79.37 is below both, and EMA13 is below EMA34 and falling, so both act as overhead resistance. [Bearish]
- MACD: Line -0.476 is below signal -0.453, a bearish crossover since Nov 12. The histogram is only about -0.02 and has narrowed from roughly -0.05 on Nov 13 midday. Momentum is bearish but starting to flatten. [Bearish]
- Bollinger Bands (20): Upper $81.22, lower $78.87, midline about $80.05. Price sits in the lower quarter of the bands, below the midline, after tagging the lower band on the gap-down. The bands have expanded, which confirms a volatility breakout to the downside. [Bearish]
- CMF (20): -0.120, well below -0.05. It has been negative on nearly every bar since Nov 12 (from -0.095 to -0.306), which shows persistent distribution. [Distribution]
- ADX (14): 32.8 and rising steadily from 14.5 on Nov 11, so a strong trend is established. −DI (43.5) is far above +DI (14.5) and the gap is wide, so bears are in control. [Strong Trend – Bearish]
- Volume: 4.94M, roughly average for the recent hourly bars, with no capitulation spike. The heavy volume came on the gap-down, and the bounce attempts have been on light volume. A washout spike would be needed to mark a true exhaustion low. [Mildly Bearish / No capitulation]
DIVERGENCES & TRENDS
- There is no bullish RSI or MACD divergence yet. RSI made a lower low at 19.4 on Nov 13 and has held 20–22 while price ground lower, so momentum is confirming price.
- The MACD histogram is narrowing, an early sign that downside momentum is decelerating. That is not a reversal signal on its own.
- Price is below EMA13, EMA34, SMA50 ($80.21) and SMA200 ($84.29). SMA50 is below SMA200, so the long-term death cross is in force.
- Price is at VWAP ($79.42), which is neutral intraday. Price is hovering right at it after a tight consolidation.
- ADX has risen from 14.5 to 32.8 in three sessions, with −DI above +DI since Nov 12. This is a fresh, accelerating downtrend.
- The key risk is mean reversion. RSI near 20 on this timeframe has often preceded sharp snapbacks toward the EMA13 (~$79.7).
CHART PATTERNS
- Bearish Triple Top / rectangle breakdown (loose fit): Price ranged around $81–82 from Oct 22 to Nov 10, then broke down on a gap. The measured move of the ~$1.5 range projects to about $78.0–78.5.
- Bearish Pennant / Flag (forming): The tight, low-volatility consolidation around $79.4–79.9 after the sharp drop resembles a bearish pennant. A break below ~$79.30 would target about $78.4–78.0, a flagpole of ~$2.
- A bullish counter-reading is a bullish falling wedge or flag from the extreme oversold reading, but there is no upside break yet. Price would need to clear $79.71–$80.00.
POTENTIAL SCENARIOS
- Scenario 1: Bearish Continuation Lower — The pennant/flag resolves down and the strong trend (ADX 32.8, −DI dominant, CMF in distribution) pushes price to the lower band and beyond. Trigger: hourly close below $79.30 and below the $79.00 area. Target: $78.50–$78.80, with an extension to $78.00. Invalidation: hourly close above $80.00 (above EMA13 and the SMA50 area). (52% probability)
- Scenario 2: Bullish Oversold Relief Bounce — RSI near 20 triggers a mean-reversion bounce that stalls at the declining EMAs. Trigger: close above $79.71 (EMA13) on rising volume with the MACD histogram turning positive. Target: $80.20–$80.40 (SMA50 and EMA34). Invalidation: loss of $78.87 (lower Bollinger band). (36% probability)
- Scenario 3: Neutral Choppy Base — Price digests the drop in a narrow range with a drifting ADX. Trigger: repeated holds between $78.90 and $79.70. Target: $79.20–$79.50. Invalidation: a decisive close outside $78.80–$79.80. (12% probability)
PRICE TARGETS
Timeframe: 6 days (Nov 21, 2026). Range width check: $81.00 − $77.00 = $4.00, which is 5.0% of the current price. That fits the ~3.5–6% guidance for 6 days and is wider than a 2–3 day range.
- Target Price: $78.80 (about 0.7% below current)
- Expected Range: $77.00 to $81.00
- Key Levels: Support at $78.87 (lower Bollinger band; a break opens $78.00 and then $77.19), Resistance at $79.71 (EMA13; above it, $80.21 SMA50)
OVERALL BIAS
OVERALL BIAS: BEARISH - The trend is strong and fresh (ADX 32.8, −DI 43.5 vs +DI 14.5), with a MACD bearish cross, persistent CMF distribution, and price below all key averages including a death-cross structure. The oversold RSI of 20 raises the odds of a bounce toward $79.7–$80.2, which would likely fail at the declining EMAs, so I expect price to drift lower toward $78.80.
This is educational analysis and not financial advice.