TSLA 4-day bearish forecast — Nov 15, 2026
- Bias: Bearish
- Timeframe: 4 days (made Nov 15, 2026, target date Nov 18, 2026)
- Price at analysis: $390.14
- Price target: $386.50
- Expected range: $381.50 – $398.50
- Result: Pending — graded after the close on Nov 18, 2026
Get a free AI analysis of TSLA today
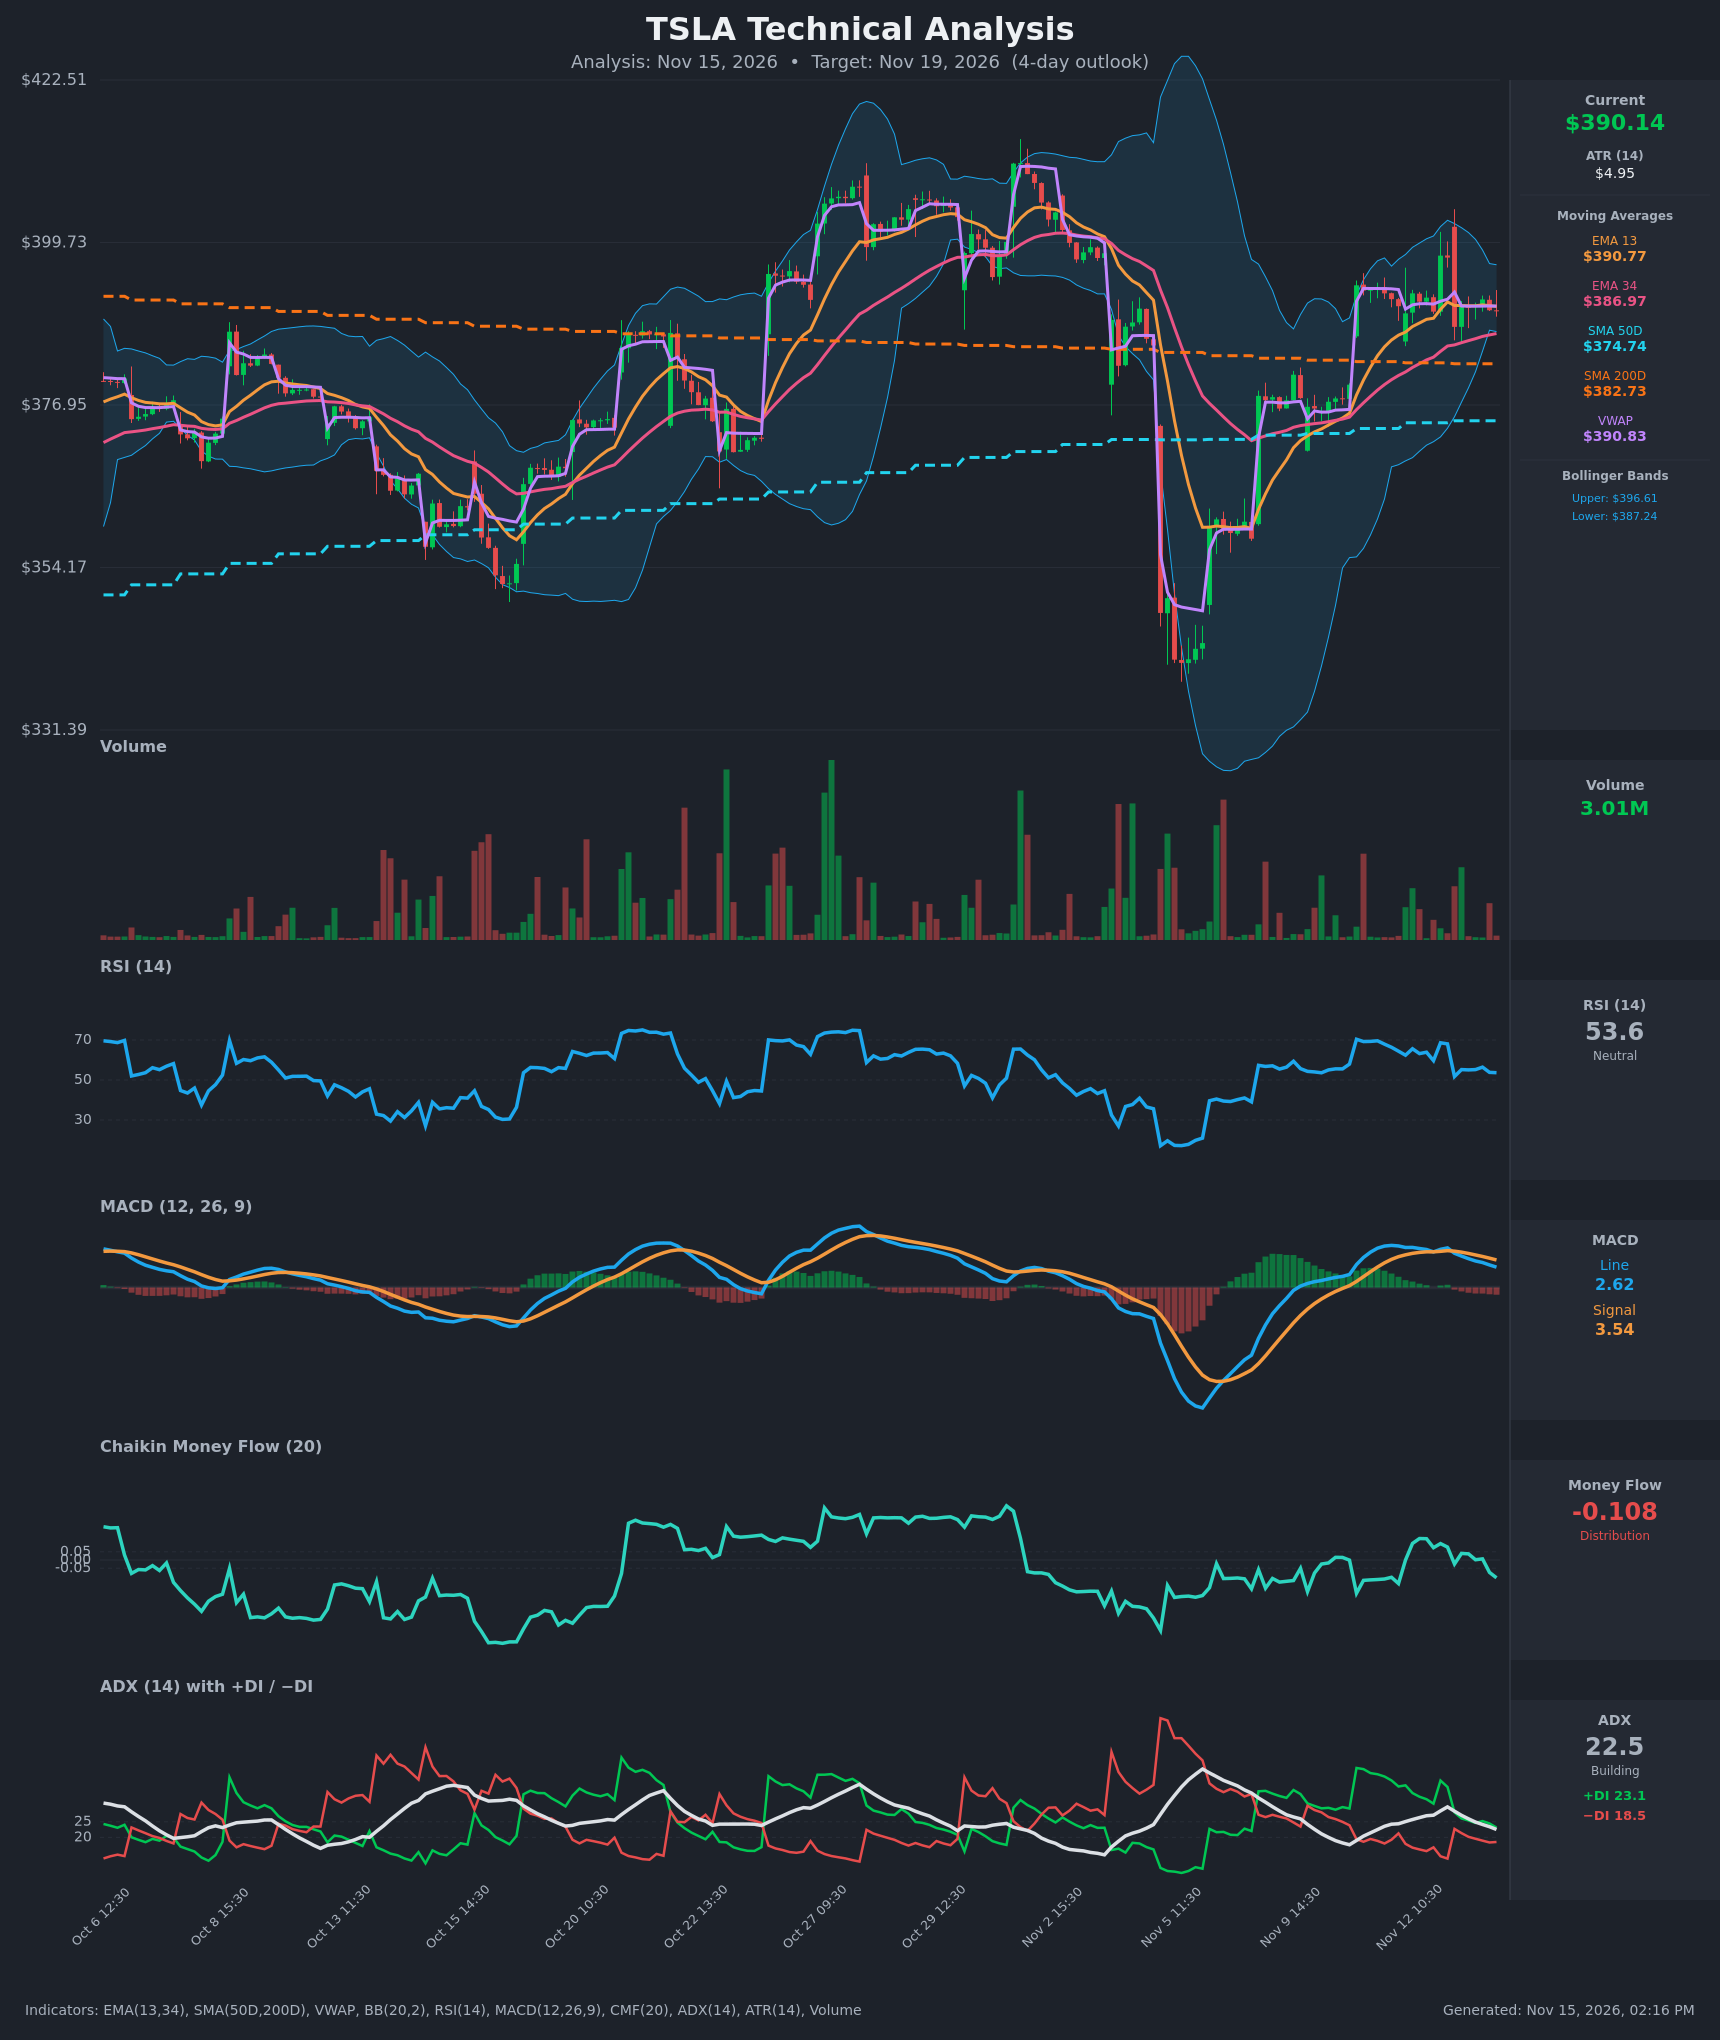
Analysis
TECHNICAL INDICATORS
- RSI (14): 53.65, down sharply from the 68 reached on Nov 12 and now back near the 50 midline. Momentum is fading, but it is neither overbought nor oversold. [Neutral]
- 20 EMA: The data gives EMA 13 at $390.77 and EMA 34 at $386.97. Price ($390.14) sits just below the EMA13 and is flat to it, while still above the EMA34, which is the next support. The EMA13 has gone flat after a strong rise, and the gap to the EMA34 is narrowing. [Neutral]
- MACD: Line 2.62 is below signal 3.54, a bearish crossover that occurred around Nov 12-13. The histogram is negative (about -0.92) and has been falling for several bars, so momentum is rolling over. [Bearish]
- Bollinger Bands (20): Upper $396.61 and lower $387.24, with the midline near $391.9. The bands have contracted sharply after the volatile Nov 5-6 swing. Price is just below the midline and well inside the bands, which points to a volatility squeeze and a pending expansion. [Neutral]
- CMF (20): -0.108, below the -0.05 threshold and falling from positive readings earlier on Nov 12. This is distribution, with sellers absorbing the recent rally. [Distribution]
- ADX (14): 22.5 and falling from 29.8, with +DI 23.1 barely above −DI 18.5. The gap between the DIs has collapsed from 23 points to under 5. The trend is weak and fading, with only a marginal bullish edge. [Weak Trend, slight bullish DI edge]
- Volume: 3.01M, with no expansion on the recent bounces. Volume is subdued compared with the heavy spikes on the Nov 5-6 selloff and rebound, so there is no conviction behind a breakout in either direction. [Neutral / low conviction]
DIVERGENCES & TRENDS
- Momentum divergence: Price printed a high near $397.89 on Nov 12, and MACD and RSI have since faded while price holds around $390. This is a mild bearish momentum deterioration, though not a clean divergence.
- Crossovers: The MACD bearish crossover is confirmed. EMA13 is still above EMA34, so there is no bearish EMA cross yet, but the spread is narrowing.
- Long-term trend: Price is above the SMA200 ($382.73) and SMA50 ($374.74). The SMA50 is still below the SMA200, so there is no golden cross, but the gap is closing as the recovery continues.
- VWAP: Price ($390.14) is just below VWAP ($390.83), a slight sign of selling pressure.
- DI and ADX: The DI spread and ADX are both compressing, which signals trend exhaustion and a transition into a range.
- Money flow: CMF has rolled from +0.13 to -0.108, which is bearish.
CHART PATTERNS
- Primary read: After the V-shaped recovery from the ~$360 low, price is consolidating in a tightening $387-$398 range. This resembles a Bullish Pennant/Flag or a Symmetrical Triangle from the reference diagram. A bullish pennant normally resolves upward, which is the main risk to a bearish view.
- Conflicting evidence: A bullish continuation is not backed by the indicators. The MACD bearish cross, CMF distribution and falling ADX argue against it. Price has also repeatedly failed near $397-$400, so the upper boundary is acting like a lower-high, flat-top consolidation.
- Targets: A breakdown below $387 (the lower band and EMA34 zone) targets the SMA200 at ~$382.7. A breakout above $398 targets the $404-$410 region, a measured move of roughly the range height.
POTENTIAL SCENARIOS
- Scenario 1: Bearish Drift to EMA34/SMA200 Support — Fading momentum and distribution push price down toward the lower Bollinger Band and EMA34. Trigger: a break below $387.24 on a close, with MACD histogram staying negative. Target: $386-$383. Invalidation: a close above $397 with volume expansion. (45% probability)
- Scenario 2: Neutral Range Consolidation — Weak ADX and a squeeze keep price oscillating between $387 and $396 around VWAP and the EMA13. Trigger: holds above the EMA34 ($386.97) and below the upper band ($396.61). Target: $388-$393. Invalidation: a decisive close outside the $386-$398 range. (25% probability)
- Scenario 3: Bullish Pennant Breakout — Price reclaims the EMA13 and VWAP and breaks the upper band as the squeeze resolves higher. Trigger: a close above $396.61 with rising volume and a MACD re-cross. Target: $400-$405. Invalidation: a fall back below $390 and the EMA34. (30% probability)
PRICE TARGETS
Timeframe: 4 days (Nov 19, 2026). The ATR of $4.95 implies a typical daily swing of about 1.3%, so a ~4-day expected range of ±2.2% is reasonable.
- Target Price: $386.50 (4-day)
- Expected Range: $381.50 to $398.50 (width $17.00 ≈ 4.4% of current price, in line with the 2-4% guide for 2-3 days scaled up for 4 days)
- Key Levels: Support at $387.24 (lower Bollinger Band, with the EMA34 at $386.97 and SMA200 at $382.73 below), Resistance at $396.61 (upper Bollinger Band; the Nov 12 high near $397.89 sits just above)
OVERALL BIAS
OVERALL BIAS: BEARISH - The MACD bearish crossover with a falling histogram, CMF distribution (-0.108), RSI rolling over from 68, and a collapsing ADX/DI spread all point to fading upside momentum. That favors a pullback toward the $387 / EMA34 / SMA200 support zone, though the SMA200 support and the bullish-pennant structure limit the downside.
This is educational analysis and not financial advice.