TSLA 6-day bearish forecast — Nov 15, 2026
- Bias: Bearish
- Timeframe: 6 days (made Nov 15, 2026, target date Nov 20, 2026)
- Price at analysis: $390.14
- Price target: $386.50
- Expected range: $376.50 – $399.50
- Result: Pending — graded after the close on Nov 20, 2026
Get a free AI analysis of TSLA today
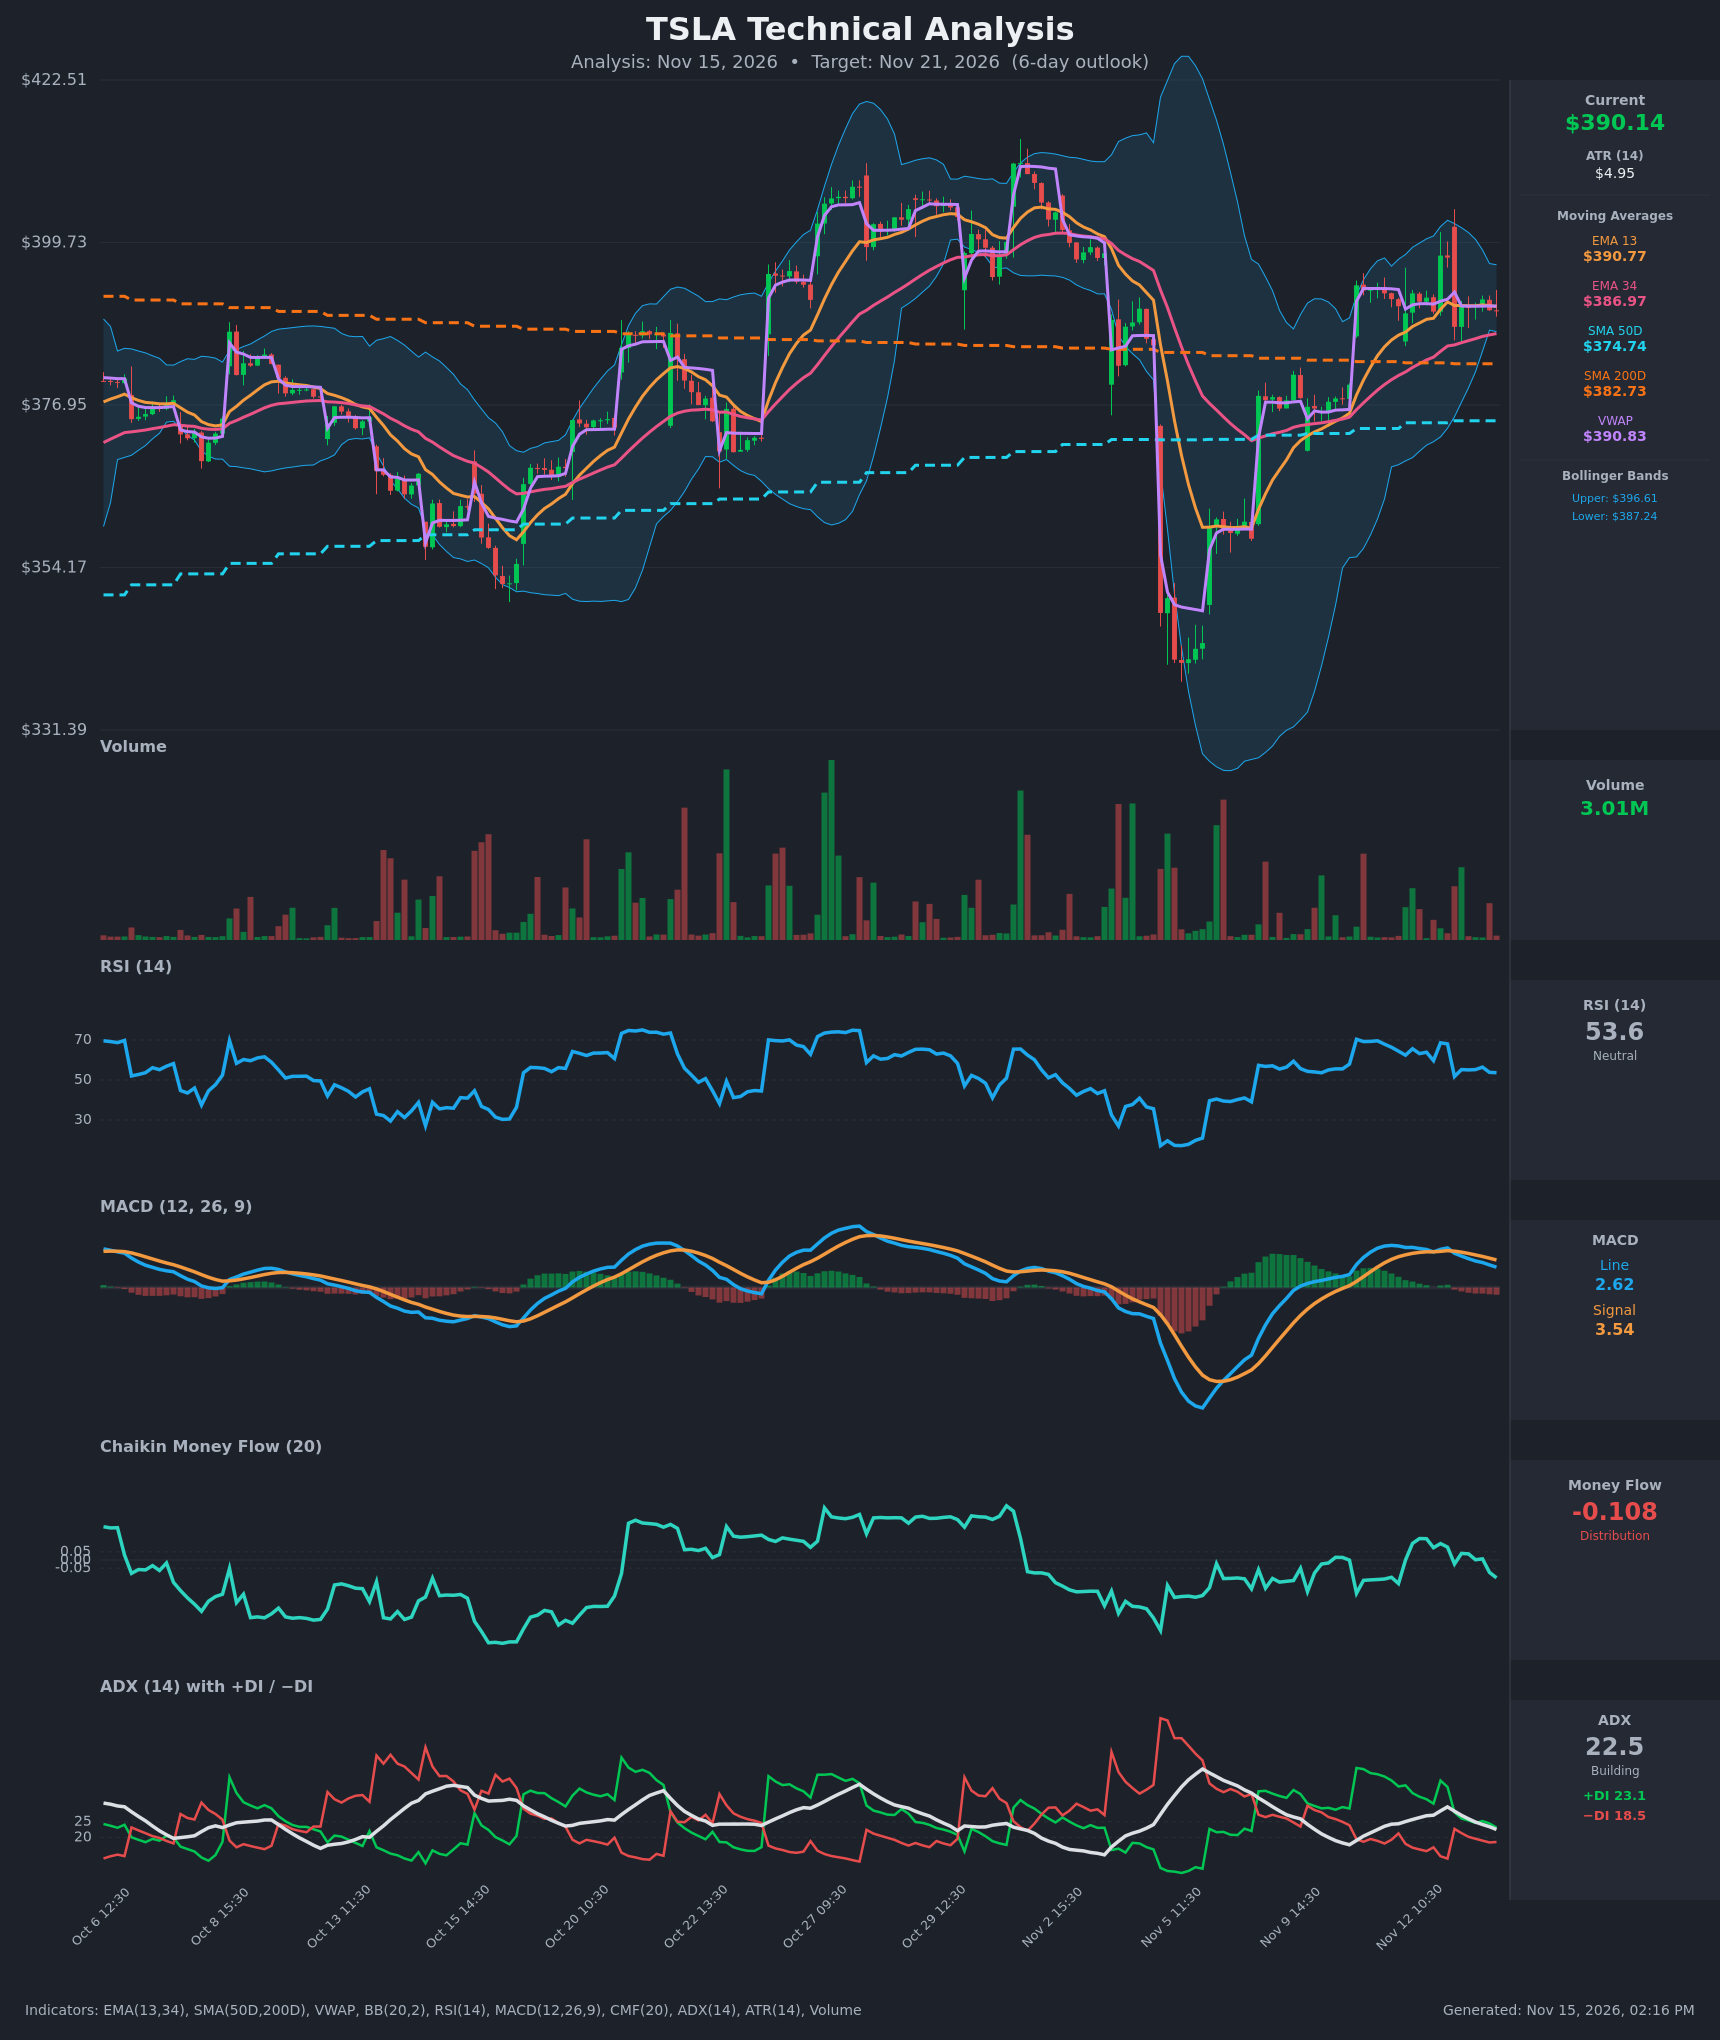
Analysis
TECHNICAL INDICATORS
- RSI (14): 53.65, down sharply from 68 on Nov 12 and now near the midline. Momentum has cooled from near-overbought, and the two spikes to ~70 on the chart both failed to hold. [Neutral]
- 20 EMA: The data supplies EMA 13 ($390.77) and EMA 34 ($386.97). Price at $390.14 is just below EMA13, which is now flat, and about $3 above EMA34. EMA13 is above EMA34 (bullish alignment), but the gap is narrowing. [Neutral]
- MACD: Line 2.62 vs signal 3.54, a bearish crossover that happened on Nov 12-13. The histogram is negative and still falling. The line is down from 5.3 and is still above zero, so the pullback is shallow but momentum is fading. [Bearish]
- Bollinger Bands (20): Upper $396.61, lower $387.24, midline about $391.9. Price sits just below the midline in a narrow band after the volatility blowout in early November. The squeeze favors range trading, with the lower band and EMA34 clustered near $387. [Neutral]
- CMF (20): -0.108, below the -0.05 threshold, and it has rolled over from slightly positive readings on Nov 12. This is distribution: closes are weak relative to the bar range. [Distribution]
- ADX (14): 22.5 and falling from 29.8, with +DI 23.1 over −DI 18.5. Bulls are nominally ahead, but the DI gap has shrunk from 23 points to under 5 and the trend is losing strength. [Weak Trend, slight bullish lean fading]
- Volume: 3.01M, unremarkable and below the spike bars seen in the prior swings. Nothing confirms a breakout in either direction. The big-volume bars on the chart were on the sell-off and rebound, not the current consolidation. [Neutral / low conviction]
DIVERGENCES & TRENDS
- Price held near $390-392 over the last 8 bars while MACD, RSI, ADX and CMF all declined. That is momentum eroding without a price decline yet, a mild bearish divergence.
- MACD bearish crossover (line below signal) with a falling histogram.
- CMF has gone from +0.13 to -0.108, so money flow is turning negative.
- ADX is falling from 29.8 to 22.5 and the +DI/−DI spread is compressing. A −DI crossover is possible within a few sessions.
- Price is slightly below EMA13 and VWAP ($390.83), a minor short-term negative.
- Longer-term structure remains constructive: price is above SMA200 ($382.73) and SMA50 ($374.74), and SMA50 is below SMA200 (no golden cross yet). EMA13 is above EMA34.
CHART PATTERNS
- Price has traded in a tight range of roughly $387-$398 since Nov 11 after a V-shaped recovery from the ~$340 low. That resembles a small consolidation or flag-like pause after the rally, closest to a Bullish Pennant/Flag in structure.
- The lower highs after the $397.89 peak, together with the MACD/CMF deterioration, give it a slight Symmetrical Triangle feel. That makes the resolution direction uncertain, and the momentum indicators lean toward a downside resolution.
- Measured reference: the range is about $11, so a break below $387 projects to roughly $380-383, which is the SMA200 area. A break above $398 projects toward $405-408.
POTENTIAL SCENARIOS
- Scenario 1: Bearish Pullback to EMA34/SMA200 — Fading momentum (MACD below signal, CMF distribution, ADX falling) drives a break of the $387 cluster of EMA34 and the lower Bollinger Band. Trigger: hourly close below $386.97. Target: $382.73 (SMA200), possibly $380. Invalidation: reclaim of $397 on rising volume. (45% probability)
- Scenario 2: Neutral Range Chop — Price stays pinned between EMA34/lower band and the upper band, oscillating around VWAP and EMA13 while MACD resets. Trigger: continued closes between $387 and $396. Target: $388-$393. Invalidation: a close outside $386 or $398. (30% probability)
- Scenario 3: Bullish Range Breakout — Buyers defend EMA34, MACD turns back up, and price breaks the recent high. Trigger: close above $398 with volume above ~4M. Target: $403-$407. Invalidation: fall back below $390 and EMA13 after the breakout. (25% probability)
PRICE TARGETS
Timeframe: 6 days (Nov 21, 2026). The range is $23 wide, about 5.9% of the current price, which fits the 4-8% guidance for this horizon and is wider than a 2-3 day range. ATR of $4.95 supports a roughly 1.2-1.5 ATR daily-equivalent move over 6 days.
- Target Price: $386.50
- Expected Range: $376.50 to $399.50
- Key Levels: Support at $386.97, Resistance at $397.89
OVERALL BIAS
OVERALL BIAS: BEARISH - Momentum is deteriorating (MACD bearish cross with a falling histogram, CMF in distribution, ADX and RSI rolling over) while price stalls under EMA13 and VWAP. A drift toward EMA34/SMA200 support in the $383-387 area is the most likely outcome, though the longer-term structure above SMA200 limits the downside.
This is educational analysis and not financial advice.