XLE 6-day bullish forecast — Nov 15, 2026
- Bias: Bullish
- Timeframe: 6 days (made Nov 15, 2026, target date Nov 20, 2026)
- Price at analysis: $64.93
- Price target: $65.40
- Expected range: $63.20 – $67.10
- Result: Pending — graded after the close on Nov 20, 2026
Get a free AI analysis of XLE today
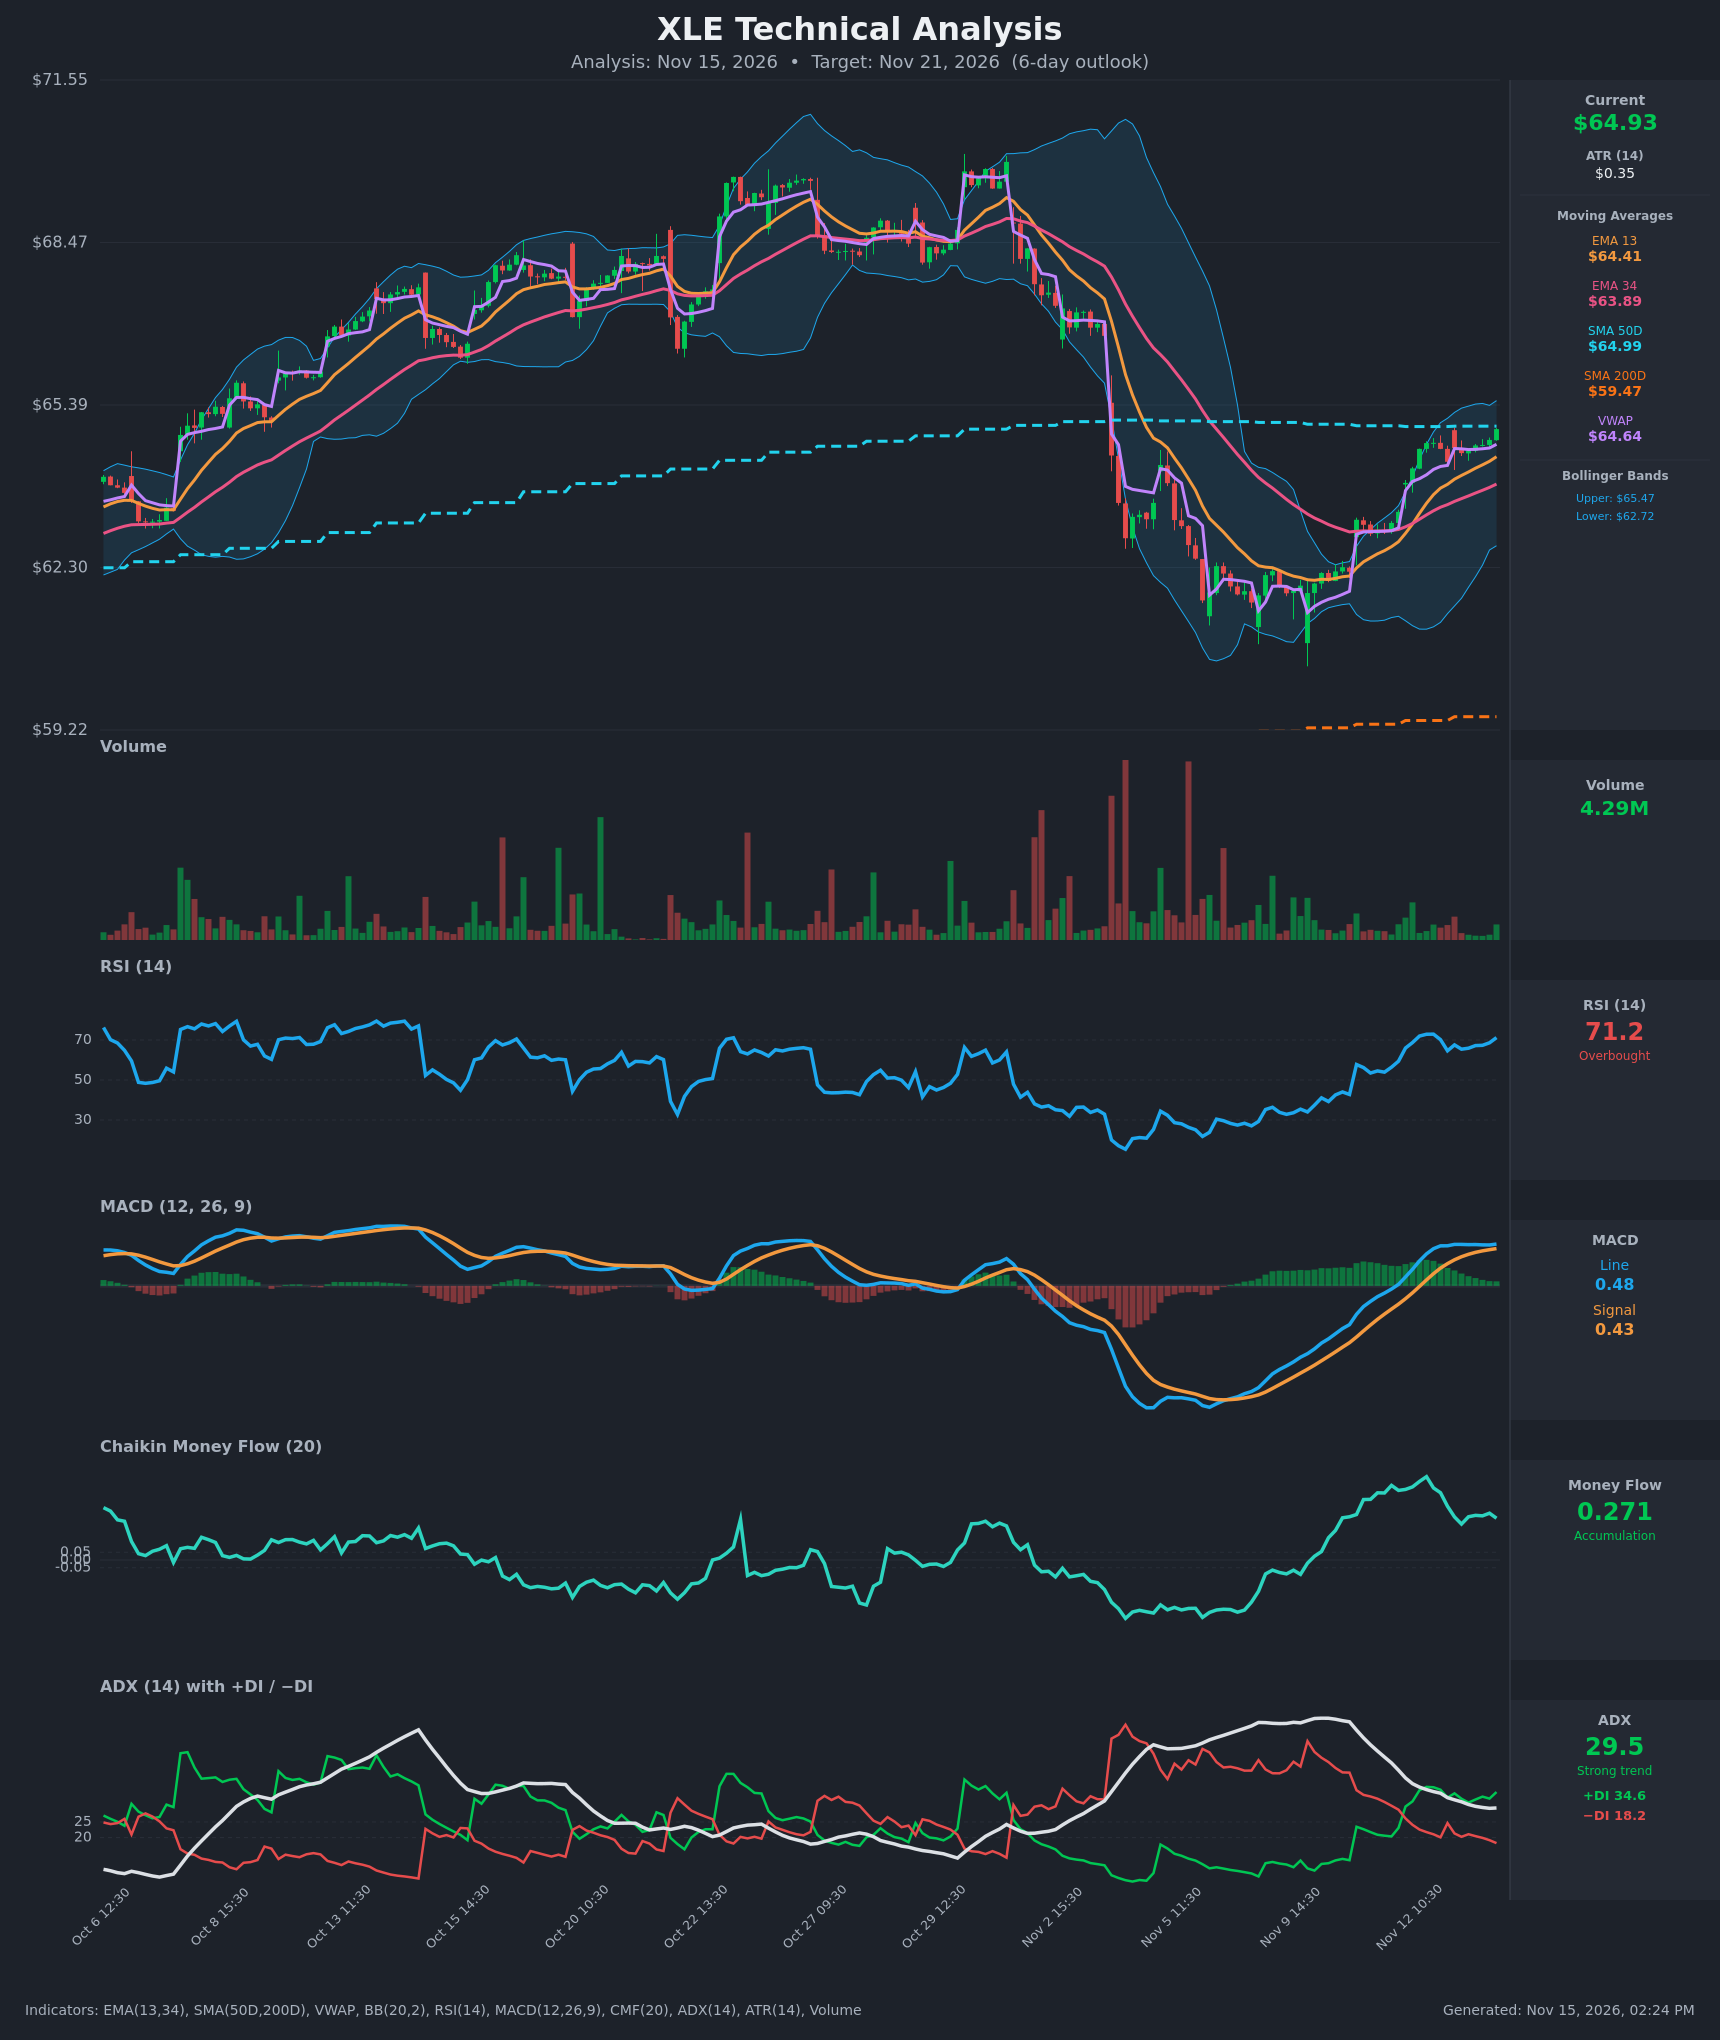
Analysis
TECHNICAL INDICATORS
- RSI (14): 71.2, just back into overbought after dipping to about 64.6 on Nov 12 and recovering. Momentum is rising and the V-shaped recovery from sub-30 in early November is strong. Overbought readings in a strong trend can persist, but they raise short-term pullback risk. [Bullish]
- 20 EMA: The chart shows EMA 13 at $64.41 and EMA 34 at $63.89 (no 20 EMA is supplied). Price at $64.93 is above both, and EMA13 has been above EMA34 since about Nov 12 12:30. The EMA13 is rising and acts as near-term support. [Bullish]
- MACD: Line 0.480 is above Signal 0.429, with a positive histogram of about +0.05. The bullish crossover came on Nov 12 around 11:30. The line has flattened near 0.47-0.48 and the histogram is narrowing, which shows momentum plateauing rather than accelerating. [Bullish]
- Bollinger Bands (20): Upper $65.47, lower $62.72, so the midline is about $64.09. Price at $64.93 sits in the upper third, about $0.54 below the upper band, and the bands are widening after the squeeze. This shows a bullish bias with limited room before the band is tested. [Bullish]
- CMF (20): 0.271, well above +0.05. It peaked above 0.5 on Nov 12 and has eased to 0.27, but it remains firmly positive after a sustained turn from negative. [Accumulation]
- ADX (14): 29.5 with +DI 34.6 above −DI 18.2. ADX is above 25 but has declined from 41.5 as the earlier downtrend faded and the new uptrend matured. The wide +DI/−DI gap confirms bullish control. [Strong Trend + Bullish]
- Volume: 4.29M on the latest bar, which is modest. Recent up-bar volume is not expanding, so the rally lacks strong participation. Price is above VWAP ($64.64). [Neutral to mildly Bullish]
DIVERGENCES & TRENDS
- No clear RSI or MACD divergence. Price is making higher highs and RSI is back at 71, though the MACD line has flattened and the histogram is shrinking, an early sign of momentum plateauing.
- ADX is falling from 41.5 to 29.5 while +DI rises. The strong trend of the prior downtrend is being replaced by a new bullish trend, and the DI crossover on Nov 12 is confirmed.
- EMA13 crossed above EMA34 (bullish) and price has reclaimed both. Price is at the SMA50D ($64.99), which is flat and acts as immediate resistance. SMA200D ($59.47) is well below, so the long-term trend is up. A golden cross is not an issue, since SMA50D is already far above SMA200D.
- Price is testing the SMA50D and the upper Bollinger Band (about $65.47) simultaneously, a confluence resistance zone.
- VWAP sits just under price at $64.64, offering support.
CHART PATTERNS
- Recovery from the Nov 9-10 low: The sharp V-shaped rebound from about $61 resembles a Bullish Double Bottom/Falling Wedge reversal. The prior decline from about $69 to $61 and the rebound have retraced roughly half of the drop.
- Current consolidation: Over the last several bars price is compressing in a tight range ($64.3-$64.9) just under the SMA50D, a mini bullish flag/pennant. A break above $65.00-$65.50 targets roughly $66.0-$66.5 (a flag-pole measure of about $2-3 is too aggressive for 6 days).
- Resistance at $65.5-$66 is the first meaningful supply zone, followed by the $67 area from the earlier breakdown.
POTENTIAL SCENARIOS
- Scenario 1: Bullish Breakout Above SMA50D — Price clears the SMA50D and upper band, continuing the trend with ADX and CMF supportive. Trigger: close above $65.50 on rising volume. Target: $66.00-$66.60. Invalidation: close back below $64.40 (EMA13). (45% probability)
- Scenario 2: Neutral Consolidation Below Resistance — Overbought RSI and SMA50D resistance stall the rally, and price chops between $64.10 and $65.40. Trigger: repeated rejection at $65.00-$65.50 with fading volume. Target: $64.50-$65.10. Invalidation: close beyond $65.60 or below $63.90. (30% probability)
- Scenario 3: Bearish Pullback — Overbought RSI, narrowing MACD histogram and rejection at the upper band trigger profit-taking back toward the EMA34. Trigger: break below $64.40 (EMA13). Target: $63.60-$63.90. Invalidation: reclaim of $65.20. (25% probability)
PRICE TARGETS
For a 6-day horizon the expected range width is ~6% of price (about $3.90).
- Target Price: $65.40 (6 days)
- Expected Range: $63.20 to $67.10 (width $3.90, about 6.0%)
- Key Levels: Support at $64.41 (EMA13), Resistance at $65.47 (upper Bollinger Band)
OVERALL BIAS
OVERALL BIAS: BULLISH - Price is above rising EMAs and VWAP, with MACD and DI bullish, CMF in accumulation and ADX at 29.5 confirming a strong uptrend. Overbought RSI and the SMA50D/upper-band resistance cap the upside, so the expected gain is modest.
This is educational analysis and not financial advice.