XLE 4-day bullish forecast — Nov 15, 2026
- Bias: Bullish
- Timeframe: 4 days (made Nov 15, 2026, target date Nov 18, 2026)
- Price at analysis: $64.93
- Price target: $65.30
- Expected range: $63.90 – $66.70
- Result: Pending — graded after the close on Nov 18, 2026
Get a free AI analysis of XLE today
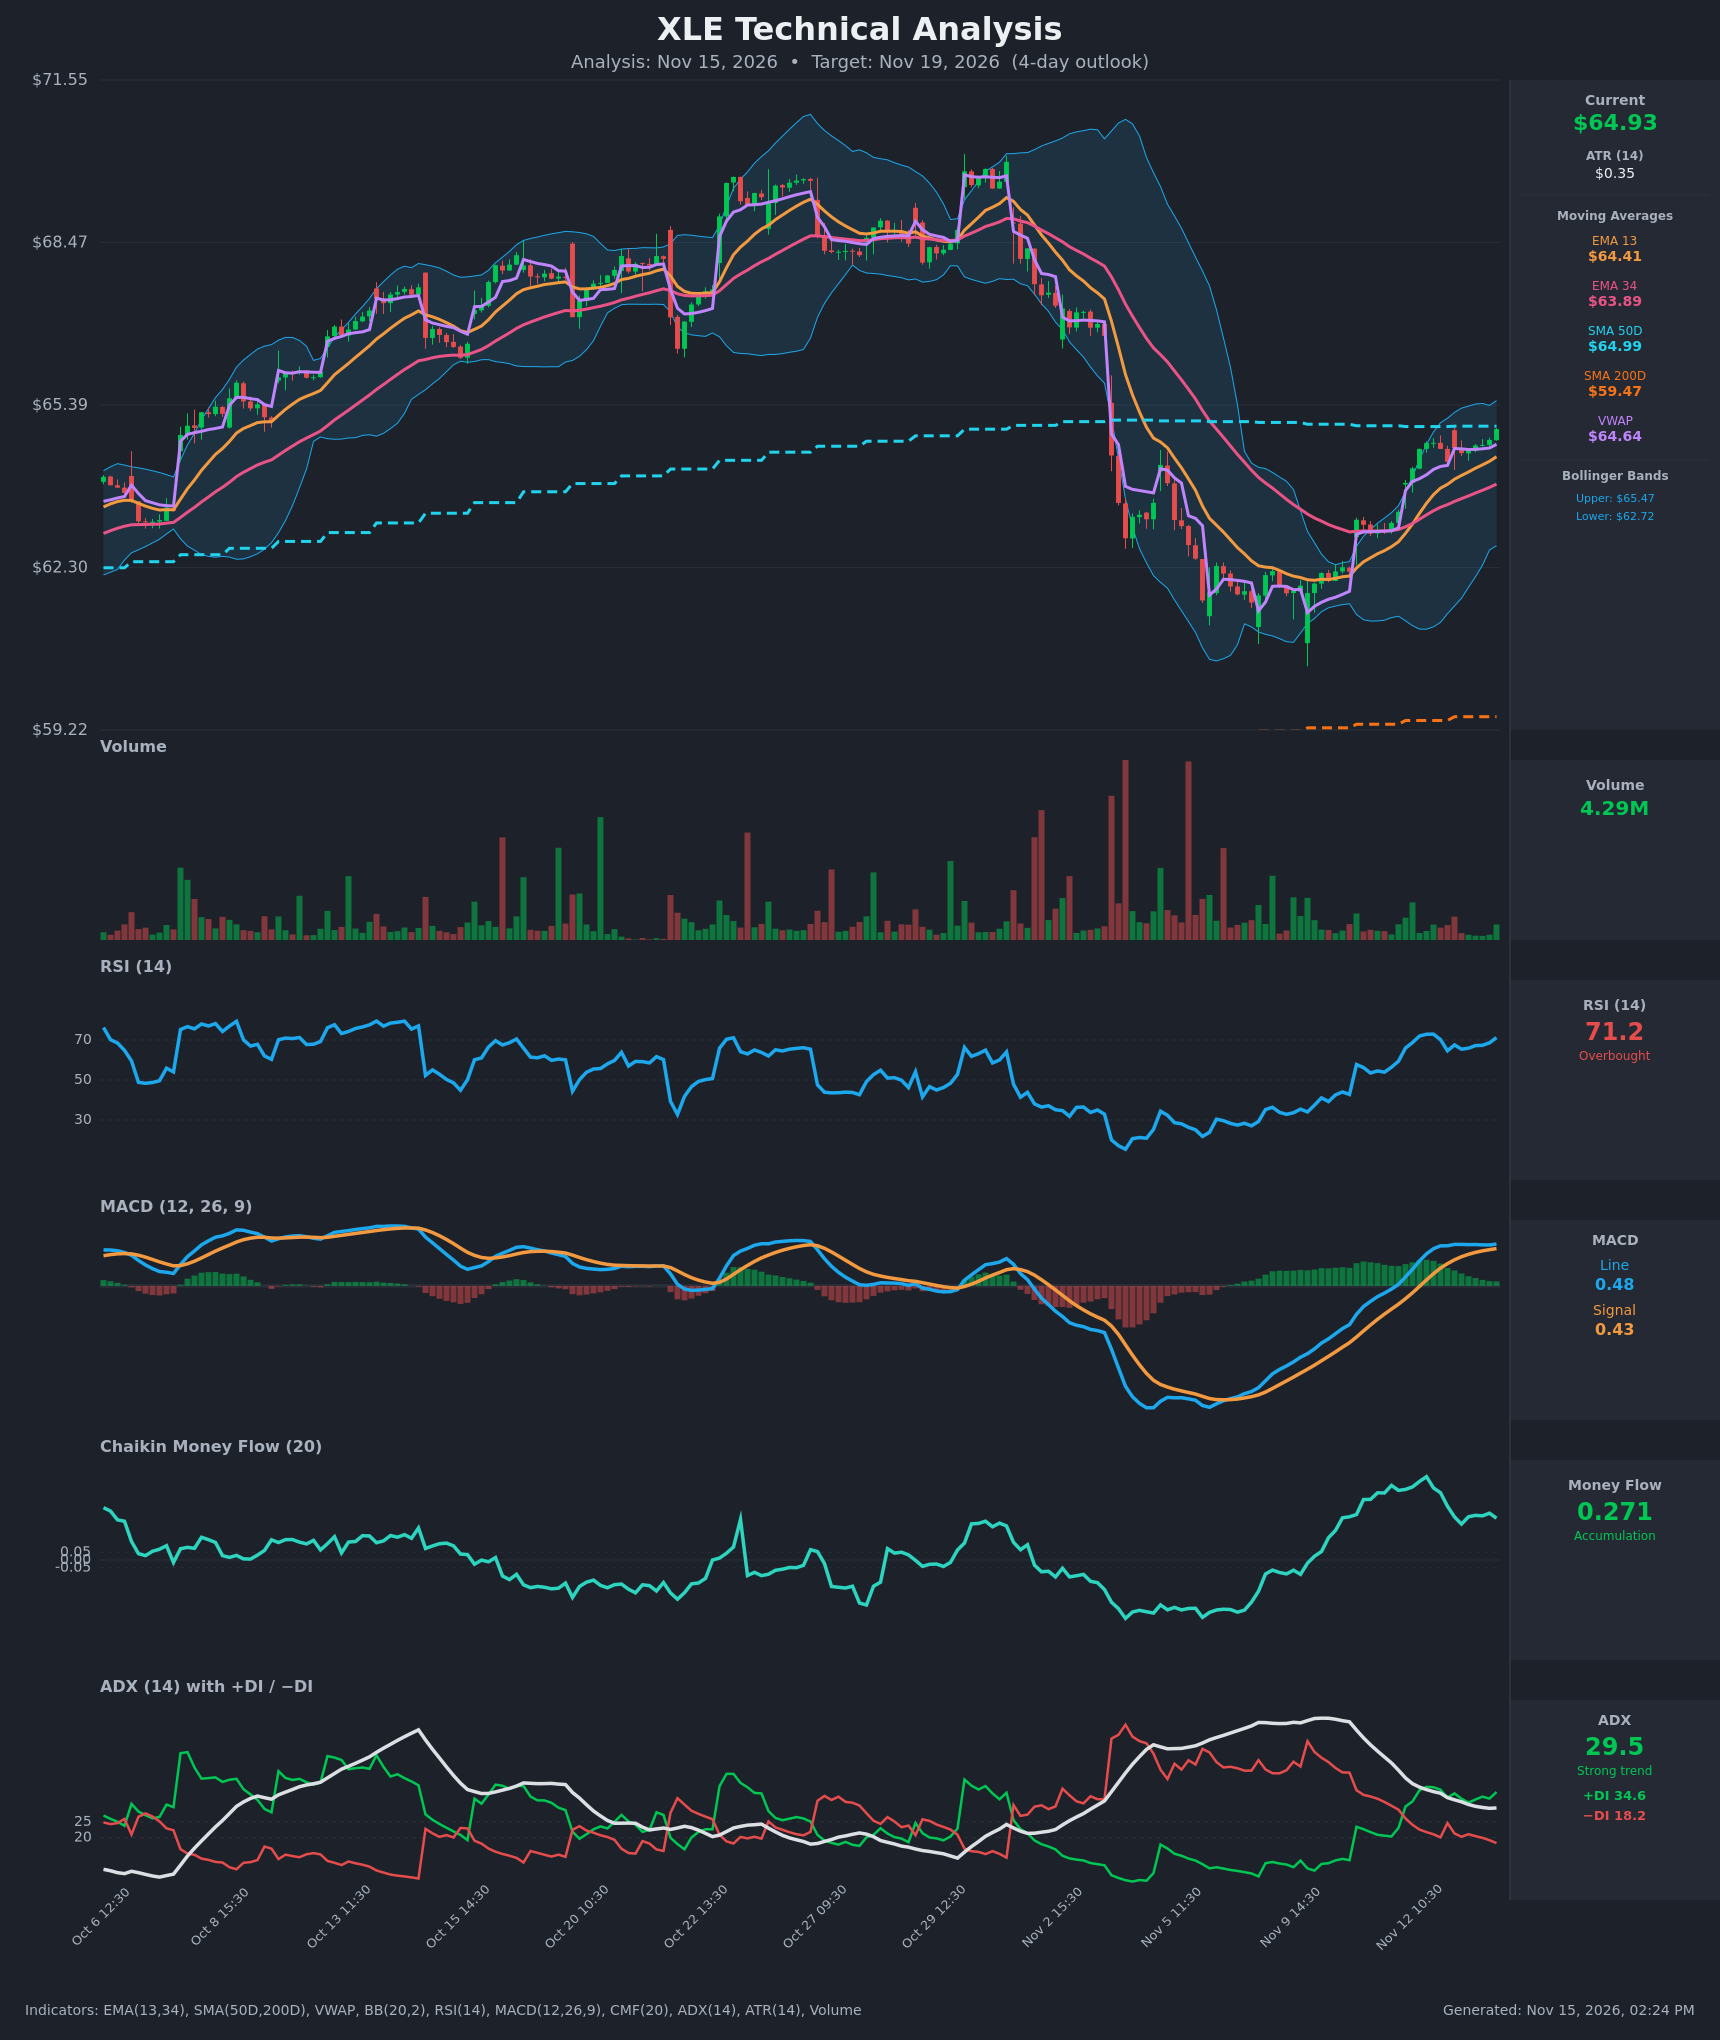
Analysis
TECHNICAL INDICATORS
- RSI (14): 71.2, just into overbought territory after climbing from the high-20s in early November. It dipped to 64.6 on Nov 12 and has since rebounded, so momentum is still rising but stretched. [Bullish]
- 20 EMA: The chart shows EMA 13 at $64.41 and EMA 34 at $63.89. Price at $64.93 is above both, and EMA13 is above EMA34 with a widening gap, so the short-term trend is up and the EMAs act as dynamic support. [Bullish]
- MACD: Line 0.480 is above signal 0.429, with a positive histogram of about 0.05. The line crossed above the signal on Nov 12 and has been flat near 0.47–0.48 since, so momentum is positive but plateauing. The histogram is shrinking from its earlier peak. [Bullish]
- Bollinger Bands (20): Upper $65.47, lower $62.72, so price sits in the upper quarter of the band (about 80% of the way up). The bands are starting to widen after a squeeze. There is about $0.54 of room to the upper band, which is a short-term ceiling. [Bullish]
- CMF (20): 0.271, well above +0.05, so accumulation is clear. It has eased from its 0.54 peak but has held above 0.23 for the whole session, which shows sustained buying pressure. [Accumulation]
- ADX (14): 29.5 with +DI 34.6 above −DI 18.2. The trend is strong and bulls are in control. ADX is drifting lower from 41, so the trend is maturing and its strength is fading. [Strong Trend – Bullish]
- Volume: 4.29M on the latest bar, about average. Recent up-moves have come on moderate volume without any blow-off spike. The chart's larger volume spikes were on the early-November selloff. [Neutral to mildly supportive]
Other levels:
- SMA50D: $64.99, directly overhead and acting as resistance. Price is $0.06 below it.
- SMA200D: $59.47, far below, so the long-term trend is up.
- VWAP: $64.64, with price above it, which is mildly bullish.
DIVERGENCES & TRENDS
- There is no clear bearish RSI divergence yet. RSI at 71.2 is a higher reading than the Nov 13 morning lows of about 65, and price is making marginally higher closes.
- The MACD line has stalled at about 0.47–0.48 while price edged higher. This is a mild loss of momentum, and the histogram is no longer expanding.
- ADX is falling from 41.5 to 29.5 even as price rises. This suggests the rally is maturing rather than accelerating.
- The EMA13 crossed above EMA34 during the Nov 12 session, a bullish crossover.
- The MACD bullish crossover on Nov 12 is confirmed.
- Price has rallied from about $60.5 to $64.93, a roughly 7% rebound off the early-November low. The 50-day SMA sits right at the current price, which is the key test.
- A Golden Cross is already in place (SMA50 well above SMA200).
CHART PATTERNS
- The decline from about $68.5 to $60.5 was followed by a V-shaped recovery. No classic reversal pattern from the reference diagram is completed.
- The recent consolidation around $64.3–$64.9 resembles a small Bullish Flag / Pennant on the intraday bars. A break above SMA50 and the upper Bollinger Band at about $65.47 would target roughly $66.0–$66.5, using the flag-pole measured move.
- The failure at SMA50 (about $65.0) and the overbought RSI leave a risk of a short Double Top-style stall near $65.0–$65.5, with a pullback target at the EMA13/VWAP cluster at about $64.4–$64.6.
POTENTIAL SCENARIOS
- Scenario 1: Bullish Breakout Above SMA50 — Price clears the SMA50 at about $65.0 and the upper Bollinger Band at $65.47, supported by CMF accumulation and +DI dominance. Trigger: close above $65.50 on firm volume. Target: $66.00–$66.40. Invalidation: close back below $64.40 (EMA13). (45% probability)
- Scenario 2: Neutral Consolidation Under Resistance — Price stalls at the SMA50 and upper band while RSI cools from overbought, chopping between $64.30 and $65.40. Trigger: repeated rejections at $65.0–$65.4. Target: $64.60–$65.20. Invalidation: a decisive break above $65.50 or below $64.00. (30% probability)
- Scenario 3: Bearish Pullback From Overbought — RSI above 70 and the SMA50 resistance trigger profit-taking, and price falls back to the EMAs. Trigger: close below $64.40 with MACD histogram turning negative. Target: $63.90–$64.10 (EMA34). Invalidation: reclaim of $65.00 with volume. (25% probability)
PRICE TARGETS
For a 4-day timeframe, the range width should be about 3–5% of price. ATR of $0.35 over 4 days implies about ±$0.70 typical movement, so a ~$2.80 range is reasonable (about 4.3%).
- Target Price: $65.30 (4-day target; modest upside as trend, CMF and +DI favor bulls, capped by SMA50 and the upper Bollinger Band)
- Expected Range: $63.90 to $66.70 (width $2.80 = ~4.3%)
- Key Levels: Support at $64.41 (EMA13; further support at $63.89 EMA34), Resistance at $65.47 (upper Bollinger Band, just above the SMA50 at $64.99)
OVERALL BIAS
OVERALL BIAS: BULLISH - Price is above both EMAs and VWAP, with a MACD bullish crossover, strong CMF accumulation (0.27) and +DI well above −DI. Overbought RSI and the SMA50 overhead limit the upside, so conviction is modest.
This is educational analysis and not financial advice.