KWEB 4-day bullish forecast — Nov 15, 2026
- Bias: Bullish
- Timeframe: 4 days (made Nov 15, 2026, target date Nov 18, 2026)
- Price at analysis: $22.93
- Price target: $23.12
- Expected range: $22.50 – $23.45
- Result: Pending — graded after the close on Nov 18, 2026
Get a free AI analysis of KWEB today
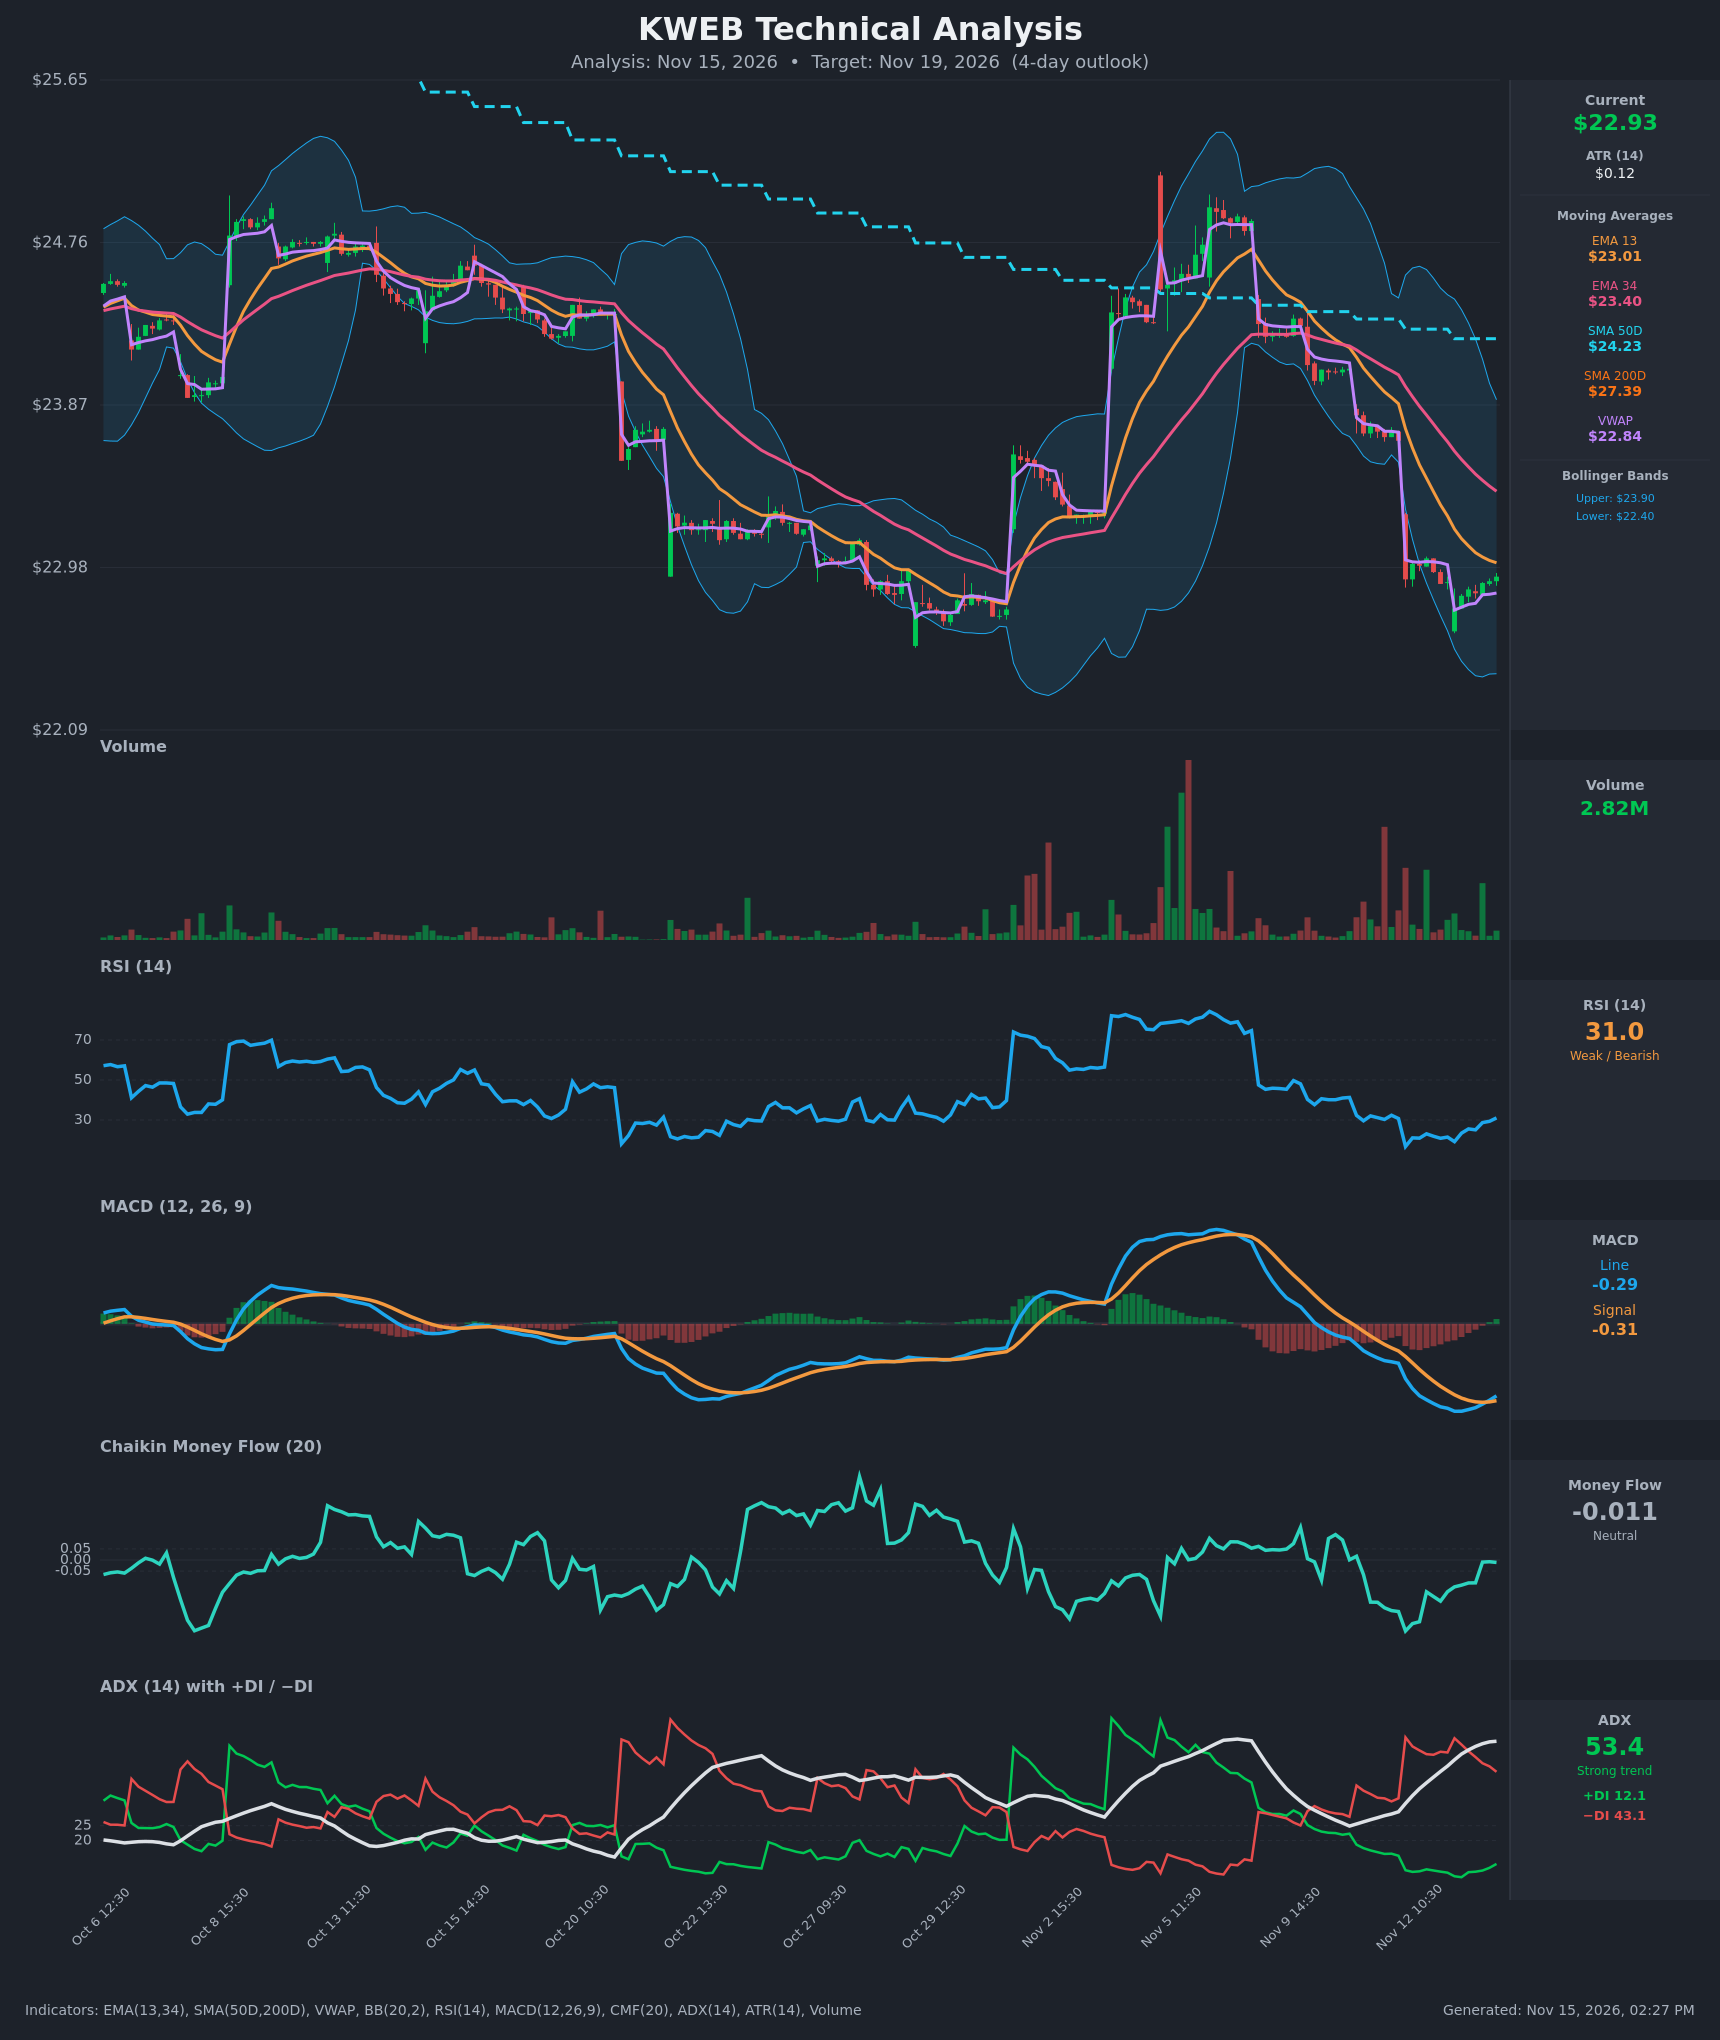
Analysis
TECHNICAL INDICATORS
- RSI (14): 31.04, up from a 16.7 low on Nov 12 and a 19.2 low on Nov 13 open. Momentum is hooking higher from deeply oversold, but RSI is still under 40 and has not reclaimed 50. [Neutral]
- 20 EMA: Only EMA 13 ($23.01) and EMA 34 ($23.40) are supplied, so these stand in for the 20 EMA. Price ($22.93) is below both, and both are falling, so they act as resistance. EMA 13 is only $0.08 overhead and is the first hurdle. [Bearish]
- MACD: Line -0.295 vs signal -0.315. The line crossed above the signal in the last bar, so the histogram has just turned slightly positive. This is an early bullish cross, but it sits well below zero and is a weak signal inside a downtrend. [Bullish]
- Bollinger Bands (20): Upper $23.90, lower $22.40, midline about $23.15. Price is in the lower half, roughly 35% of the band width, and has bounced off the lower band area. The bands are fairly wide after the volatile move, so there is room for a mean-reversion move toward the midline. [Neutral]
- CMF (20): -0.011, in the neutral zone. It has improved from -0.32 on Nov 12 as selling pressure faded, but there is no accumulation yet. [Neutral]
- ADX (14): 53.4 and still rising, with −DI 43.1 on top of +DI 12.1. This is a very strong, mature downtrend. The −DI is rolling over (from 54.7) and +DI is edging up, so the directional spread is narrowing. [Strong Trend – Bearish]
- Volume: 2.82M on the latest bar, higher than most recent bars, and the bar is green. This suggests dip-buying interest but is not yet a capitulation or reversal spike. [Mildly Bullish]
DIVERGENCES & TRENDS
- RSI made a new low on Nov 13 open (19.2) and has since climbed while price held roughly flat near $22.75–$23.03. This is a mild momentum improvement rather than a classic divergence.
- The MACD line is turning up against the signal line, with histogram bars shrinking from deeply negative to slightly positive. Downside momentum is decelerating.
- Longer-term structure is bearish:
- Price is below EMA 13 and EMA 34.
- Price is below SMA 50 ($24.23) and well below SMA 200 ($27.39).
- EMA 13 is below EMA 34, a bearish alignment.
- The SMA 50 is below the SMA 200, so a death cross is already in place.
- Price is slightly above VWAP ($22.84), a small intraday positive.
- The Nov 12 gap-down was followed by a tight three-day consolidation of about $22.75–$23.03.
- ADX at 53 is an extreme reading and often signals trend exhaustion, which raises the odds of a relief bounce even though the trend is not broken.
CHART PATTERNS
- Bearish flag/pennant (continuation): The gap-down from about $23.68 to $22.91 was followed by a tight sideways consolidation under falling EMAs. A break below about $22.75 would project further downside toward $22.40 (the lower Bollinger Band) and the prior October low area.
- Possible short-term base: The tight range, rising RSI and MACD cross could also form a small double-bottom-like base at $22.75. A reclaim of EMA 13 ($23.01) would target the Bollinger midline near $23.15 and EMA 34 near $23.40.
- Neither pattern is confirmed yet. The bearish flag is the larger-scale structure, so any bounce is likely to meet heavy resistance at $23.40–$23.90.
POTENTIAL SCENARIOS
- Scenario 1: Bullish Relief Bounce — Oversold RSI, the fresh MACD cross and a narrowing DI spread support a mean-reversion move toward the Bollinger midline. Trigger: hourly close above EMA 13 ($23.01) on steady volume. Target: $23.15–$23.40. Invalidation: close below $22.75. (45% probability)
- Scenario 2: Bearish Trend Continuation — The strong downtrend (ADX 53, −DI dominant) resumes and a bearish flag breaks down below the consolidation low. Trigger: break below $22.75. Target: $22.40–$22.50. Invalidation: close above $23.20. (40% probability)
- Scenario 3: Neutral Range-Bound Chop — Price keeps oscillating inside the $22.75–$23.10 consolidation. Trigger: failure to break either side. Target: $22.90–$23.00. Invalidation: close outside the $22.70–$23.15 range. (15% probability)
PRICE TARGETS
- Target Price: $23.12 (4-day)
- Expected Range: $22.50 to $23.45 (width $0.95, about 4.1% of current price, consistent with a 4-day horizon)
- Key Levels: Support at $22.75, Resistance at $23.40 (EMA 13 at $23.01 is the first minor hurdle)
OVERALL BIAS
OVERALL BIAS: BULLISH - Deeply oversold RSI turning up, a fresh MACD bullish cross, a narrowing DI spread and improving CMF favor a modest relief bounce toward the Bollinger midline. The bounce is likely capped below EMA 34, since the broader downtrend remains intact.
This is educational analysis and not financial advice.