BAC 4-day bullish forecast — Nov 15, 2026
- Bias: Bullish
- Timeframe: 4 days (made Nov 15, 2026, target date Nov 18, 2026)
- Price at analysis: $51.01
- Price target: $51.30
- Expected range: $50.55 – $52.05
- Result: Pending — graded after the close on Nov 18, 2026
Get a free AI analysis of BAC today
Analysis
TECHNICAL INDICATORS
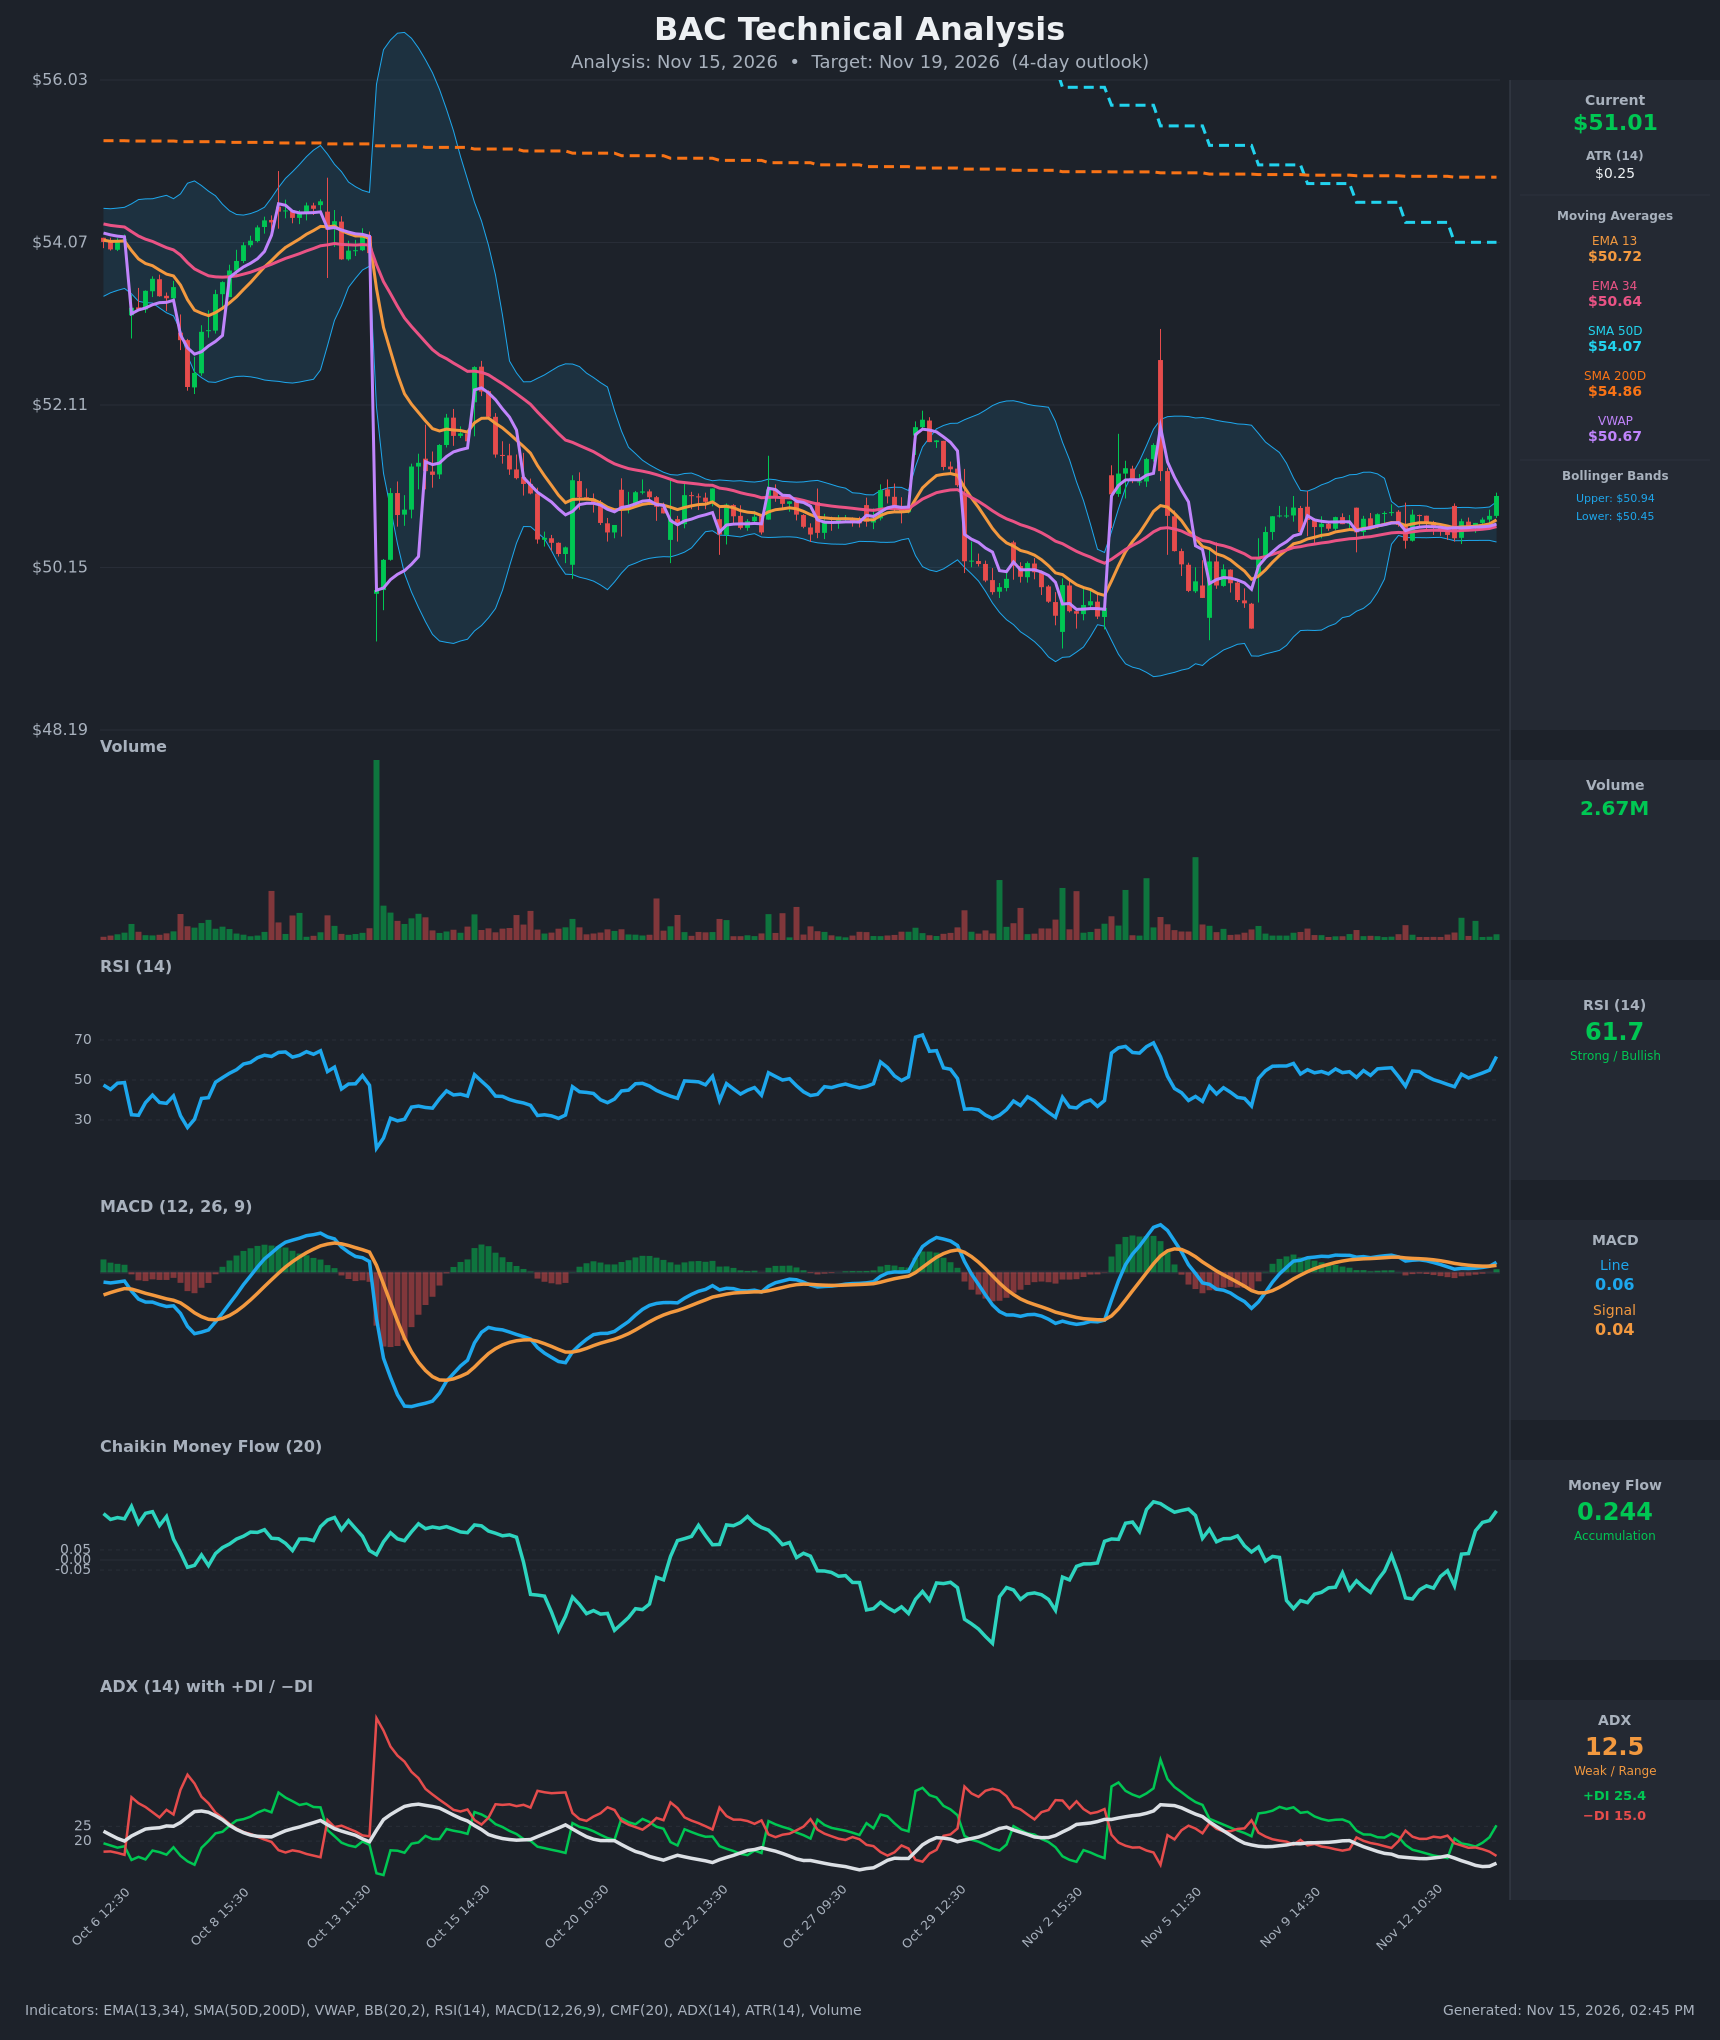
- RSI (14): 61.72, jumping from about 55 to 62 on the last bar. Momentum is rising and nearing the upper-neutral zone, but it is not overbought. [Bullish]
- 20 EMA: Using the EMA 13 ($50.72) and EMA 34 ($50.64) provided, price at $51.01 is above both. EMA13 is above EMA34, a mild bullish alignment. Both are flat, so they act as support near $50.65-$50.72. [Bullish]
- MACD: Line 0.060 is above signal 0.042, with a positive and widening histogram. The line crossed back above the signal on the last bar after a slow decline. This is a fresh bullish crossover near the zero line, so it is not yet a strong signal. [Bullish]
- Bollinger Bands (20): Price at $51.01 is above the upper band ($50.94). The bands are extremely tight (about $0.49 wide), a squeeze after a long contraction. The close outside the band is a volatility-expansion breakout attempt, but with only one bar of confirmation it could also revert to the mean (the middle band is near $50.70). [Bullish]
- CMF (20): 0.244, well above +0.05 and rising sharply from negative readings only hours earlier. This shows strong accumulation. [Accumulation]
- ADX (14): 12.5, weak and range-bound. +DI (25.4) has crossed above −DI (15.0), so the bulls hold a slight edge, but there is no established trend. [Weak Trend, bullish lean]
- Volume: 2.67M on the last bar, which is higher than the recent quiet sessions. It is still modest compared with the earlier spikes, so the breakout has only mild volume support. [Mildly bullish confirmation]
Other context: price is above VWAP ($50.67) and well below the SMA50D ($54.07) and SMA200D ($54.86). The SMA50D is below the SMA200D (death-cross configuration), so the longer-term trend is bearish and the two averages are overhead resistance.
DIVERGENCES & TRENDS
- No clear divergence. RSI, MACD and CMF are all rising together with price.
- CMF moved from -0.19 to +0.24 over the recent bars, a sharp improvement in buying pressure.
- The MACD bullish crossover came from a very shallow base, so the momentum shift is early and fragile.
- The +DI/−DI flip to bullish is recent (the −DI lead lasted through Nov 12).
- ADX at 12.5 and falling confirms the market is a tight range, not a trend. The latest move is a breakout attempt from that range.
- Long-term: price is well below the SMA50D and SMA200D, and the SMA50D is below the SMA200D (bearish structure). These overhead averages are far away ($54+), so they are not a factor over 4 days.
CHART PATTERNS
- Bollinger squeeze / tight consolidation: Over the last several sessions price has formed a narrow, flat range of about $50.45-$50.80. This resembles a small rectangle or Symmetrical Triangle-type compression. The last bar closed above the range, which is a bullish breakout attempt.
- Larger picture: Price has stabilized in a $50.15-$52.00 base after the sharp drop from about $54 (Oct 13 gap). This could be a basing/bottoming structure (similar to the Bullish Triple Top/Bottom range), but it is not confirmed.
- Targets: A measured move from the small range (about $0.35-$0.40) projects to roughly $51.35-$51.45. The next resistance is the $51.70-$52.10 area, where earlier rallies stalled.
POTENTIAL SCENARIOS
- Scenario 1: Bullish Squeeze Breakout Continuation — The close above the upper Bollinger Band, with CMF accumulation, a MACD crossover and +DI dominance, drives follow-through. Trigger: holds above $50.90 and breaks $51.15. Target: $51.40-$51.70. Invalidation: close back below $50.70 (EMA13/middle band). (50% probability)
- Scenario 2: Neutral Pullback and Retest — The breakout candle is partly retraced to the mean as ADX stays weak, and price chops between $50.65 and $51.10. Trigger: failure to extend above $51.10 on fading volume. Target: $50.70-$51.00. Invalidation: a close above $51.25 or below $50.45. (30% probability)
- Scenario 3: Bearish Failed Breakout — The band-pierce proves a false move, and price falls back through the range under the long-term bearish structure. Trigger: close below $50.65. Target: $50.30-$50.45. Invalidation: reclaim of $50.95. (20% probability)
PRICE TARGETS
For a 4-day timeframe, the range width should be about 3-6% of the current price. With ATR of $0.25, a 4-day move is about $0.50 (1 standard deviation), so I use a width of about $1.50 (about 2.9%).
- Target Price: $51.30 (for the 4-day timeframe)
- Expected Range: $50.55 to $52.05 (width $1.50, about 2.9% of $51.01)
- Key Levels: Support at $50.70, Resistance at $51.70
OVERALL BIAS
OVERALL BIAS: BULLISH - Price has broken above a tight Bollinger squeeze with a fresh MACD bullish crossover, +DI over −DI, strong CMF accumulation (0.244) and RSI rising to 62. The weak ADX and the distant overhead SMAs keep the expected move modest.
This is educational analysis and not financial advice.