BAC 6-day bullish forecast — Nov 15, 2026
- Bias: Bullish
- Timeframe: 6 days (made Nov 15, 2026, target date Nov 20, 2026)
- Price at analysis: $51.01
- Price target: $51.55
- Expected range: $49.95 – $52.55
- Result: Pending — graded after the close on Nov 20, 2026
Get a free AI analysis of BAC today
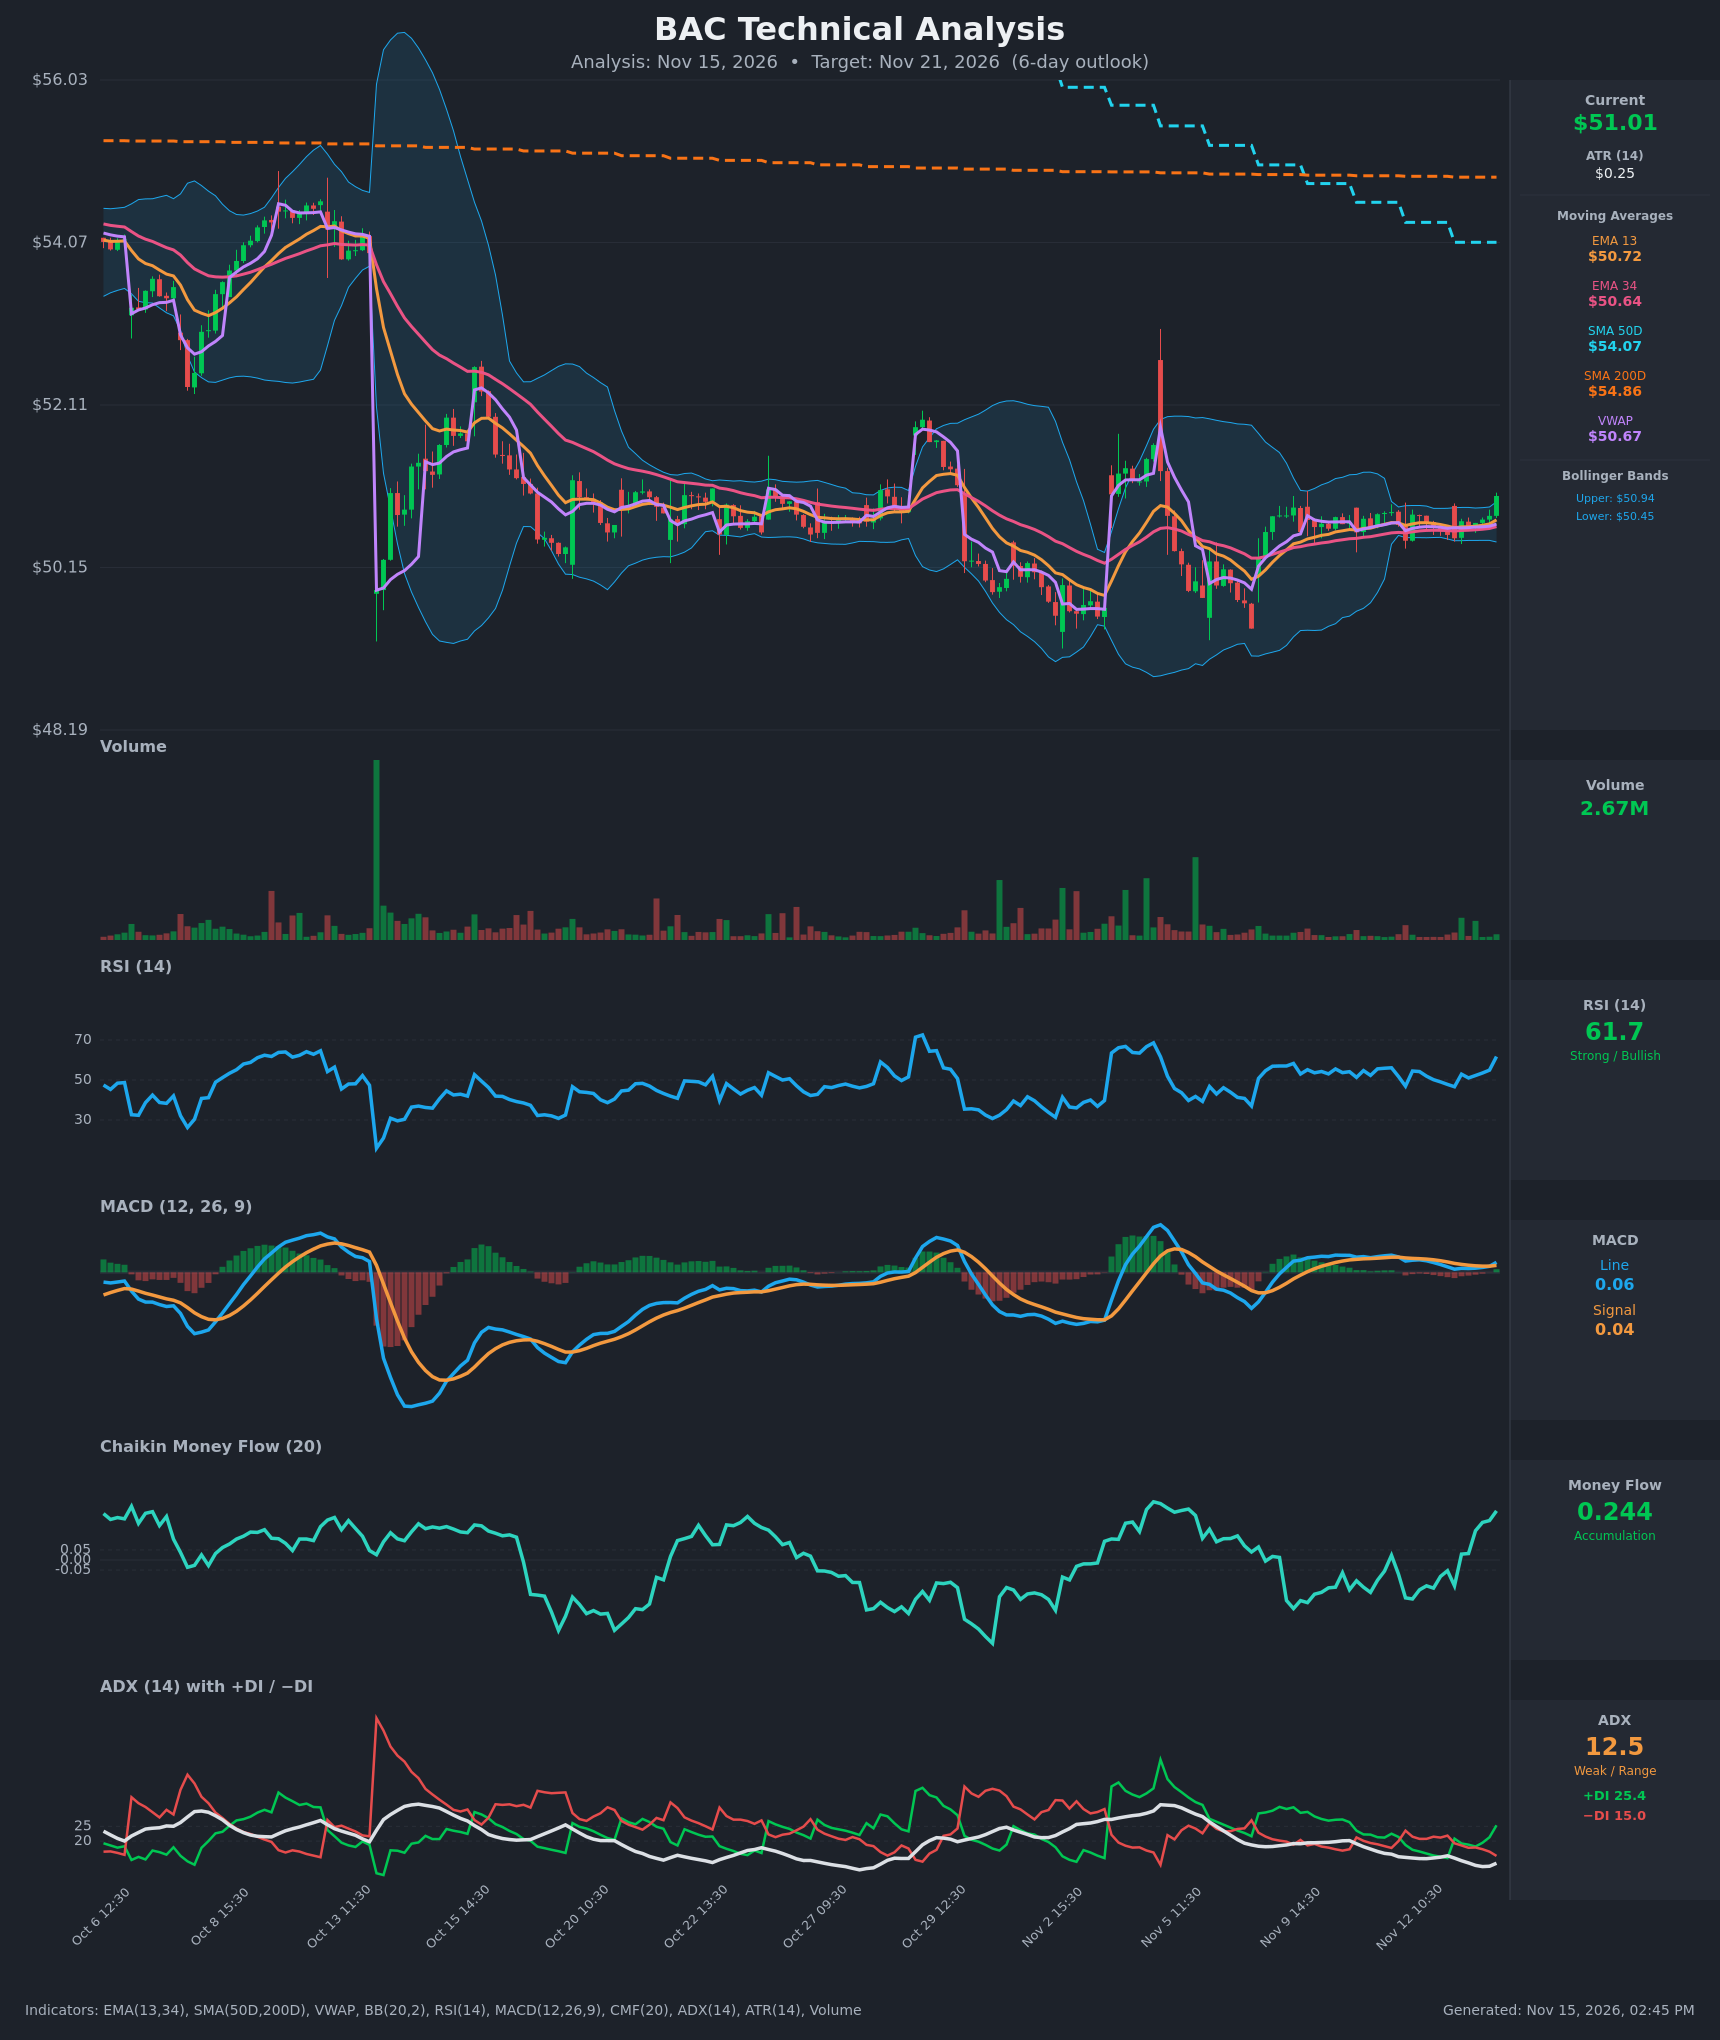
Analysis
TECHNICAL INDICATORS
- RSI (14): 61.72, up sharply from about 47 on Nov 13 morning and from 54.9 one bar earlier. Momentum is improving and has room before the 70 overbought line. [Bullish]
- 20 EMA: The provided EMAs are the 13 and 34. EMA13 is $50.72 and EMA34 is $50.64. Price at $51.01 is above both, and EMA13 has been above EMA34 since the last bar of Nov 11. Both are flat but turning up, so they act as near-term support. [Bullish]
- MACD: Line 0.060 is above signal 0.042, and it just crossed back up after a brief dip below signal on Nov 13 (0.036 vs 0.037). The histogram has turned positive after a long flat or negative stretch. The values are tiny, so this is early momentum, not a strong thrust. [Bullish]
- Bollinger Bands (20): Upper $50.94, lower $50.45. The bands are very narrow (about $0.49 wide), a squeeze after a volatile period. The last bar closed at $51.01, above the upper band, which is a squeeze breakout attempt to the upside. A close back inside the band would make it a failed break. [Bullish]
- CMF (20): 0.244, well above +0.05. It rose from -0.13 to +0.24 within a day, so buying pressure is strong and accelerating. [Accumulation]
- ADX (14): 12.5 with +DI 25.4 above −DI 15.0. The trend is weak and range-bound, but the DI crossover to the bulls on Nov 13 shows directional bias turning up. ADX is at lows and just starting to tick up (11.3 → 12.5), which is consistent with a nascent breakout. [Weak Trend, bullish direction]
- Volume: 2.67M on the breakout bar, above the very quiet volume of the past several sessions but not a spike. There is some participation, though no decisive confirmation yet. [Mildly supportive of upside]
Other context:
- Price is above VWAP ($50.67), which is bullish short term.
- Price is well below SMA50D ($54.07) and SMA200D ($54.86), and SMA50 is below SMA200. The long-term trend is down, and those averages are far overhead.
DIVERGENCES & TRENDS
- There is no meaningful price/indicator divergence. RSI, MACD and CMF all turned up together with price, which is confirming.
- CMF turned up before the final breakout bar and has risen to its highest level in about a week, a sign of accumulation inside the range.
- A fresh +DI/−DI bullish crossover occurred on Nov 13 (+DI 25.4 vs −DI 15.0). It follows a bearish DI stretch on Nov 12.
- A small MACD bullish re-cross and an EMA13 > EMA34 alignment support a short-term upturn.
- The larger trend is still bearish. The SMA50 is below the SMA200, and price has been capped under $52.3 since the Oct 13 gap down. The SMA50 is falling toward price but is still about $3 above.
- The ADX at 12.5 shows the market has been drifting sideways, so follow-through is not guaranteed.
CHART PATTERNS
- The Oct 13 gap-down was followed by a lengthy consolidation between roughly $50.2 and $52.1. The last 3 sessions form a very tight sideways coil, a Bollinger squeeze that resembles a small Symmetrical Triangle / Pennant. The final bar broke upward.
- The broader structure is a base inside a downtrend (a lower-high sequence from the $54+ level). It is not a confirmed reversal pattern, but the base lows near $50.0 have held three times (a loose triple-bottom-like floor).
- The measured move from the tight coil is only about $0.5 to $0.6 (to roughly $51.5–51.6). The larger range top near $52.1–52.3 is the next real target if momentum persists.
POTENTIAL SCENARIOS
- Scenario 1: Bullish Squeeze Breakout Continuation — Price holds above the upper Bollinger band and EMA13 and extends upward on accumulation (CMF 0.24, DI bullish). Trigger: hourly closes above $51.10 with volume above 2.5M. Target: $51.55 to $52.10. Invalidation: a close back below $50.70 (EMA13/VWAP). (50% probability)
- Scenario 2: Neutral Return to Range — The breakout stalls with ADX still under 20, and price falls back into the $50.50 to $51.00 range. Trigger: failure to hold above $50.94 with a fading RSI. Target: $50.60 to $50.90. Invalidation: a decisive hourly close above $51.30. (28% probability)
- Scenario 3: Bearish Failed Breakout — The breakout turns out to be a false break inside the longer-term downtrend, and sellers push price below the base. Trigger: a close below $50.45 (lower band). Target: $50.00 to $50.15. Invalidation: a reclaim of $51.00 on rising volume. (22% probability)
PRICE TARGETS
- Target Price: $51.55 (6-day)
- Expected Range: $49.95 to $52.55 (width $2.60 ≈ 5.1% of current price, in line with the 4–8% guide for a 6–10 day outlook)
- Key Levels: Support at $50.72 (EMA13, with VWAP $50.67 and the lower band at $50.45 just below), Resistance at $52.10 (the prior swing high zone, with SMA50 far overhead at $54.07)
OVERALL BIAS
OVERALL BIAS: BULLISH - A Bollinger squeeze breakout with a MACD bullish cross, RSI rising to 62, a bullish DI crossover and strong CMF accumulation (0.244) favors a modest upside move. The weak ADX and the overhead SMA50/SMA200 limit conviction and the size of the move.
This is educational analysis and not financial advice.