WMT 6-day bullish forecast — Nov 15, 2026
- Bias: Bullish
- Timeframe: 6 days (made Nov 15, 2026, target date Nov 20, 2026)
- Price at analysis: $128.13
- Price target: $129.40
- Expected range: $125.50 – $131.70
- Result: Pending — graded after the close on Nov 20, 2026
Get a free AI analysis of WMT today
Analysis
TECHNICAL INDICATORS
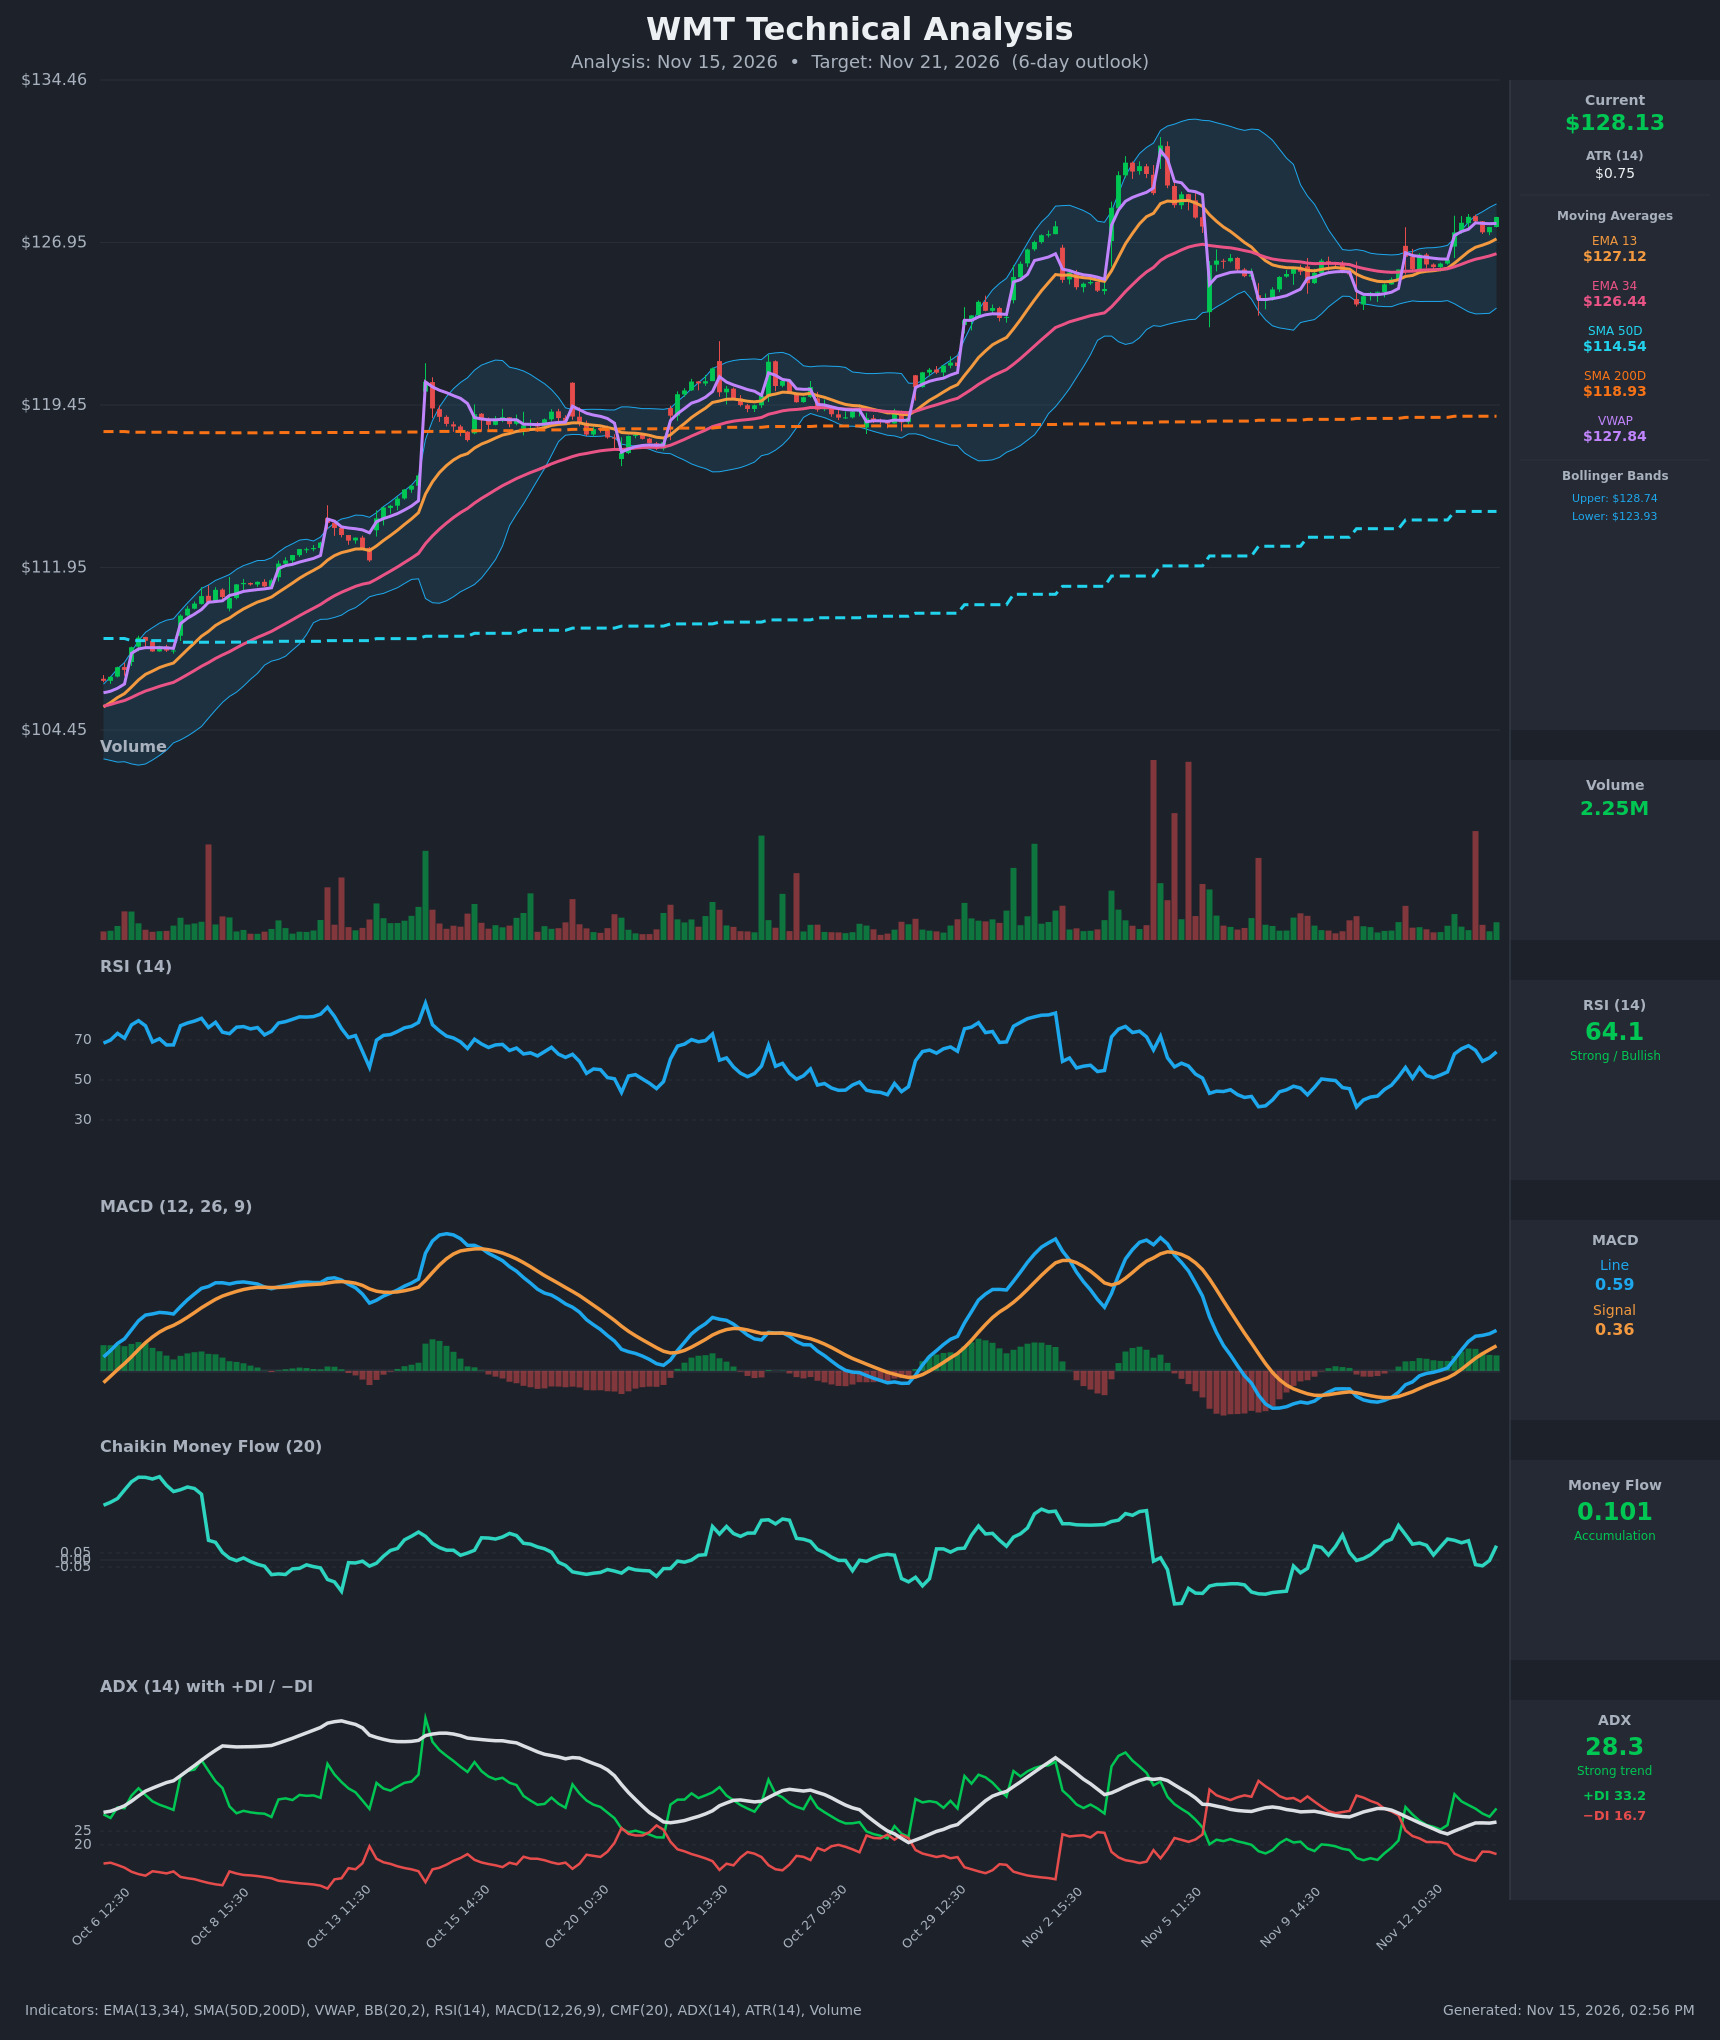
- RSI (14): 64.11, up from the low 50s on Nov 12 and a recent high of 67.1. It is strong but below the 70 overbought line, so there is still some room to run. [Bullish]
- 20 EMA: The chart shows EMA 13 at $127.12 and EMA 34 at $126.44 (no 20 EMA is plotted). Price at $128.13 is above both, and EMA13 is above EMA34 and widening, so the short-term moving averages are acting as support. [Bullish]
- MACD: Line 0.586 is above Signal 0.363, a bullish crossover that happened around Nov 13 10:30. The histogram is positive at about +0.22 and has expanded over the last several bars. Momentum is rising, though the line flattened slightly in the last few bars. [Bullish]
- Bollinger Bands (20): Upper $128.74, lower $123.93. Price at $128.13 sits in the upper band at roughly 87% of the band width, which is a strong position. The bands are starting to widen after a squeeze, which is consistent with the new upward move. Only about $0.60 of room remains to the upper band, so a short-term pullback or a band walk are both possible. [Bullish]
- CMF (20): 0.101, above +0.05. It dipped slightly negative (−0.03 to −0.04) mid-session on Nov 13 and has since recovered. That points to moderate accumulation. [Accumulation]
- ADX (14): 28.3, above 25 and rising from 23.9. +DI at 33.2 is well above −DI at 16.7, so bulls are clearly in control of a strengthening trend. [Strong Trend + Bullish]
- Volume: 2.25M on the latest bar, which is average to slightly below average. There are no major distribution spikes on the recent push higher, but there is no heavy breakout volume either, so conviction is only moderate. Price is also above VWAP ($127.84), which supports buyers. [Neutral to mildly Bullish]
DIVERGENCES & TRENDS
- There is no clear divergence. RSI (64) is rising with price, and MACD and ADX are confirming the move.
- Price is well above SMA50D ($114.54) and SMA200D ($118.93), so the long-term uptrend is intact. SMA50D has been above SMA200D since the golden cross earlier in the year, and the gap keeps widening.
- EMA13 crossed above EMA34 around Nov 12-13, and the gap is widening.
- Price is also above VWAP, which reflects buyer control.
- The Nov 5 high near $131-132 is the main overhead hurdle. That peak ran into the upper Bollinger Band and then fell sharply, so it is a reaction zone.
- A mild caution is that price is near the upper band after a quick $3 rise in two sessions, so a pause is plausible.
- CMF briefly turned negative on Nov 13 afternoon but has recovered.
CHART PATTERNS
- Bullish Falling Wedge or consolidation breakout: Price spent Nov 6-12 in a tightening range between about $124 and $127 (compressed Bollinger Bands). On Nov 13 it broke out to the upside. This resembles a bullish pennant/flag-style continuation after the earlier rally. A measured move would aim toward the prior high near $131-132.
- There is also a pattern of higher lows since the Nov 9-10 low around $124.
- Failure signal: if price falls back into the $125-126 range and below EMA34, the breakout becomes a false move.
POTENTIAL SCENARIOS
- Scenario 1: Bullish Breakout Continuation — Price holds above the EMAs and VWAP and pushes through the upper Bollinger Band, with ADX and MACD still rising. Trigger: a close above $128.74 on decent volume. Target: $130.50-$131.50, near the prior Nov 5 high. Invalidation: close below $126.40 (EMA34). (55% probability)
- Scenario 2: Neutral Consolidation / Digestion — Price stalls just beneath the upper band after the quick move and chops between $126.80 and $129. Trigger: failure to close above $128.74 and RSI flattening. Target: $127-$128.50. Invalidation: a break above $129.50 or below $126.40. (25% probability)
- Scenario 3: Bearish Pullback / Failed Breakout — Price rejects the upper band, falls back below EMA13 and VWAP, and retests the consolidation range. Trigger: close below $127.10 with a MACD histogram decline. Target: $125.50-$126.00. Invalidation: reclaim of $128.74. (20% probability)
PRICE TARGETS
For the 6-day timeframe (range guidance ~4-8% of price; ATR $0.75 supports a daily move of about $0.75-$1.00):
- Target Price: $129.40
- Expected Range: $125.50 to $131.70 (width of $6.20, about 4.8% of current price)
- Key Levels: Support at $127.12 (EMA13, with VWAP at $127.84 just above it and EMA34 at $126.44 below), Resistance at $128.74 (upper Bollinger Band), then $131.50 (prior swing high)
OVERALL BIAS
OVERALL BIAS: BULLISH - Price is above all key moving averages and VWAP, with a fresh MACD bullish crossover, a strong ADX (28.3) with +DI far above −DI, and positive CMF accumulation. The breakout from the Nov 6-12 consolidation suggests a move toward $129-$131, though proximity to the upper Bollinger Band could cause a brief pause.
This is educational analysis and not financial advice.