WMT 4-day bullish forecast — Nov 15, 2026
- Bias: Bullish
- Timeframe: 4 days (made Nov 15, 2026, target date Nov 18, 2026)
- Price at analysis: $128.13
- Price target: $129.20
- Expected range: $125.40 – $131.00
- Result: Pending — graded after the close on Nov 18, 2026
Get a free AI analysis of WMT today
Analysis
TECHNICAL INDICATORS
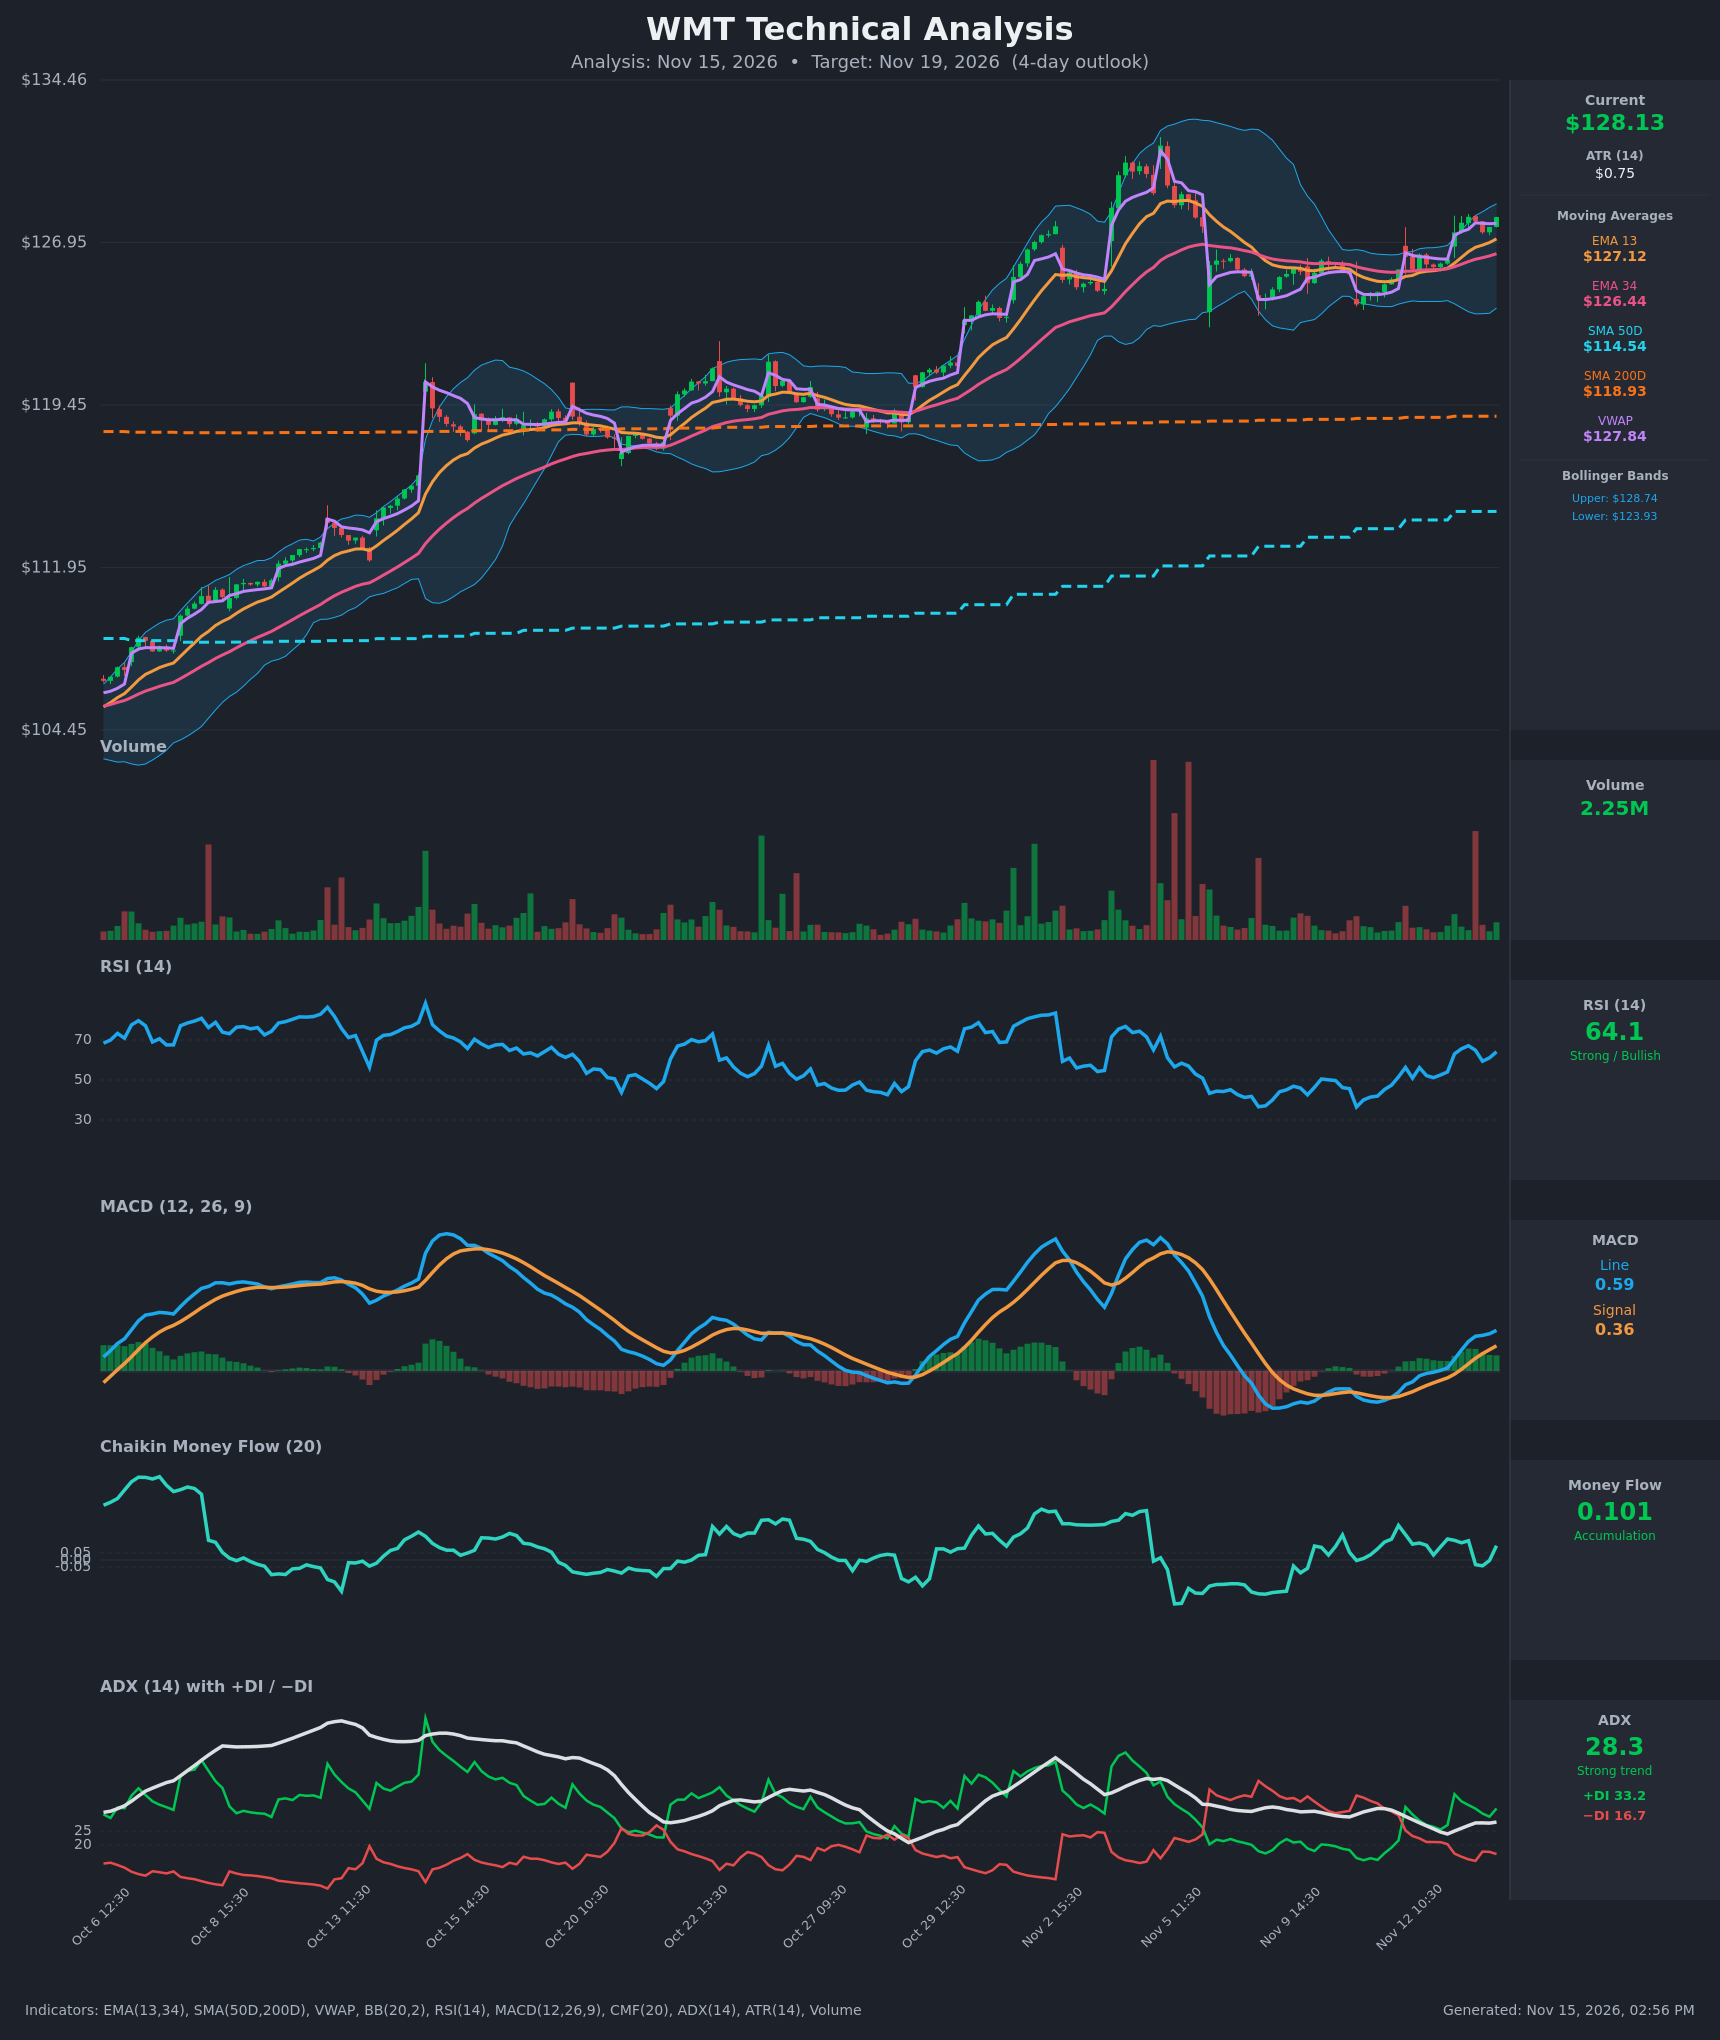
- RSI (14): 64.11, up from the low 50s on Nov 12 and a 67 peak at Nov 13 11:30. It is strong but below the 70 overbought line, so there is still room to run. [Bullish]
- 20 EMA: The provided fast and slow averages are EMA 13 at $127.12 and EMA 34 at $126.44. Price at $128.13 is above both, and EMA13 crossed above EMA34 around Nov 12-13. The spread is widening, and EMA13 is the first dynamic support. [Bullish]
- MACD: The line (0.586) is above the signal (0.363), with a positive, expanding histogram. The bullish crossover happened around Nov 13 10:30 from near zero, a fresh signal after a long corrective base. [Bullish]
- Bollinger Bands (20): Upper $128.74, lower $123.93. Price sits at the upper band (about 87% of the band width), and the bands have started to widen after a tight squeeze. This is typical of an expansion breakout, though a brief pause or walk along the upper band is possible. [Bullish]
- CMF (20): 0.101, above +0.05 after dipping slightly negative (about -0.03 to -0.04) midday Nov 13. Buying pressure has returned. [Accumulation]
- ADX (14): 28.3 and rising, with +DI at 33.2 well above −DI at 16.7. The −DI/+DI crossover on Nov 12 morning flipped control to the bulls. [Strong Trend + Bullish]
- Volume: 2.25M, modest and in line with the recent average, with no climactic spike. The breakout is not yet confirmed by heavy volume, which is a mild caution. [Neutral to mildly supportive]
DIVERGENCES & TRENDS
- There is no meaningful bearish RSI or MACD divergence. Both made higher readings alongside price over the last two sessions.
- The Nov 3-4 high near $131 came with a stronger MACD and RSI above 70. The current move has lower momentum peaks, so a retest of $131 would need fresh momentum.
- MACD and the DI lines have crossed bullishly together, and CMF has turned back above +0.05. Momentum, flow and trend are aligned.
- VWAP ($127.84) is below price, so intraday buyers are in profit and VWAP acts as nearby support.
- Price is far above SMA50 ($114.54) and SMA200 ($118.93). SMA50 is still below SMA200 but rising and narrowing the gap, so no golden cross is imminent. This is a longer-term lag, not a near-term threat.
- Price is stretched about 12% above SMA50, so a pullback to the EMAs is always possible.
CHART PATTERNS
- Bullish Flag / Ascending-Triangle-style base: From Nov 5 to Nov 12 price consolidated in a roughly $123.5-$126.5 range after the spike to $131. It then broke out above the consolidation on Nov 13 with MACD and DI confirmation. This is a continuation pattern in an uptrend.
- A measured move from the base (about a $3 range added to the ~$126 breakout level) points to the $129-$130 area, with the $131 prior high as the major hurdle.
- The expanding bands after the squeeze support the breakout. A failed breakout would show as a drop back below $126, the top of the base.
POTENTIAL SCENARIOS
- Scenario 1: Bullish Breakout Continuation — Price holds above EMA13/VWAP and pushes through the upper Bollinger Band as momentum and DI strength persist. Trigger: a close above $128.74 with volume above 2.5M. Target: $129.20-$130.50, with $131 as an extension. Invalidation: a close below $127.12 (EMA13). (55% probability)
- Scenario 2: Neutral Pause Near Upper Band — RSI cools in the mid-60s while price digests the gains between VWAP and the upper band. Trigger: low-volume inside days near $127.80-$128.70. Target: $127.50-$128.70. Invalidation: a break above $129.50 or below $126.80. (28% probability)
- Scenario 3: Bearish Pullback / Failed Breakout — Price stalls at the upper band, MACD momentum fades and price slips back into the old range. Trigger: a close below $127.12 and then $126.44 (EMA34). Target: $125.50-$126.40. Invalidation: a reclaim of $128.74. (17% probability)
PRICE TARGETS
For the 4-day timeframe, the expected range is $125.40 to $131.00, a width of $5.60 (about 4.4% of the $128.13 price), which fits the guidance for a short horizon of this length.
- Target Price: $129.20 (4 days)
- Expected Range: $125.40 to $131.00
- Key Levels: Support at $127.12 (EMA13, with VWAP at $127.84 just above it), Resistance at $128.74 (upper Bollinger Band), with the next major resistance at about $131.00 (prior swing high)
OVERALL BIAS
OVERALL BIAS: BULLISH - The MACD bullish crossover, the +DI/−DI dominance with ADX at 28.3, and CMF accumulation align with a breakout above the recent consolidation. Price is also above the rising EMA13/EMA34 and VWAP. The main risk is the stretch at the upper Bollinger Band, which could cause a brief pause below $131 resistance.
This is educational analysis and not financial advice.