BB 6-day bearish forecast — Nov 15, 2026
- Bias: Bearish
- Timeframe: 6 days (made Nov 15, 2026, target date Nov 20, 2026)
- Price at analysis: $8.90
- Price target: $8.76
- Expected range: $8.45 – $9.10
- Result: Pending — graded after the close on Nov 20, 2026
Get a free AI analysis of BB today
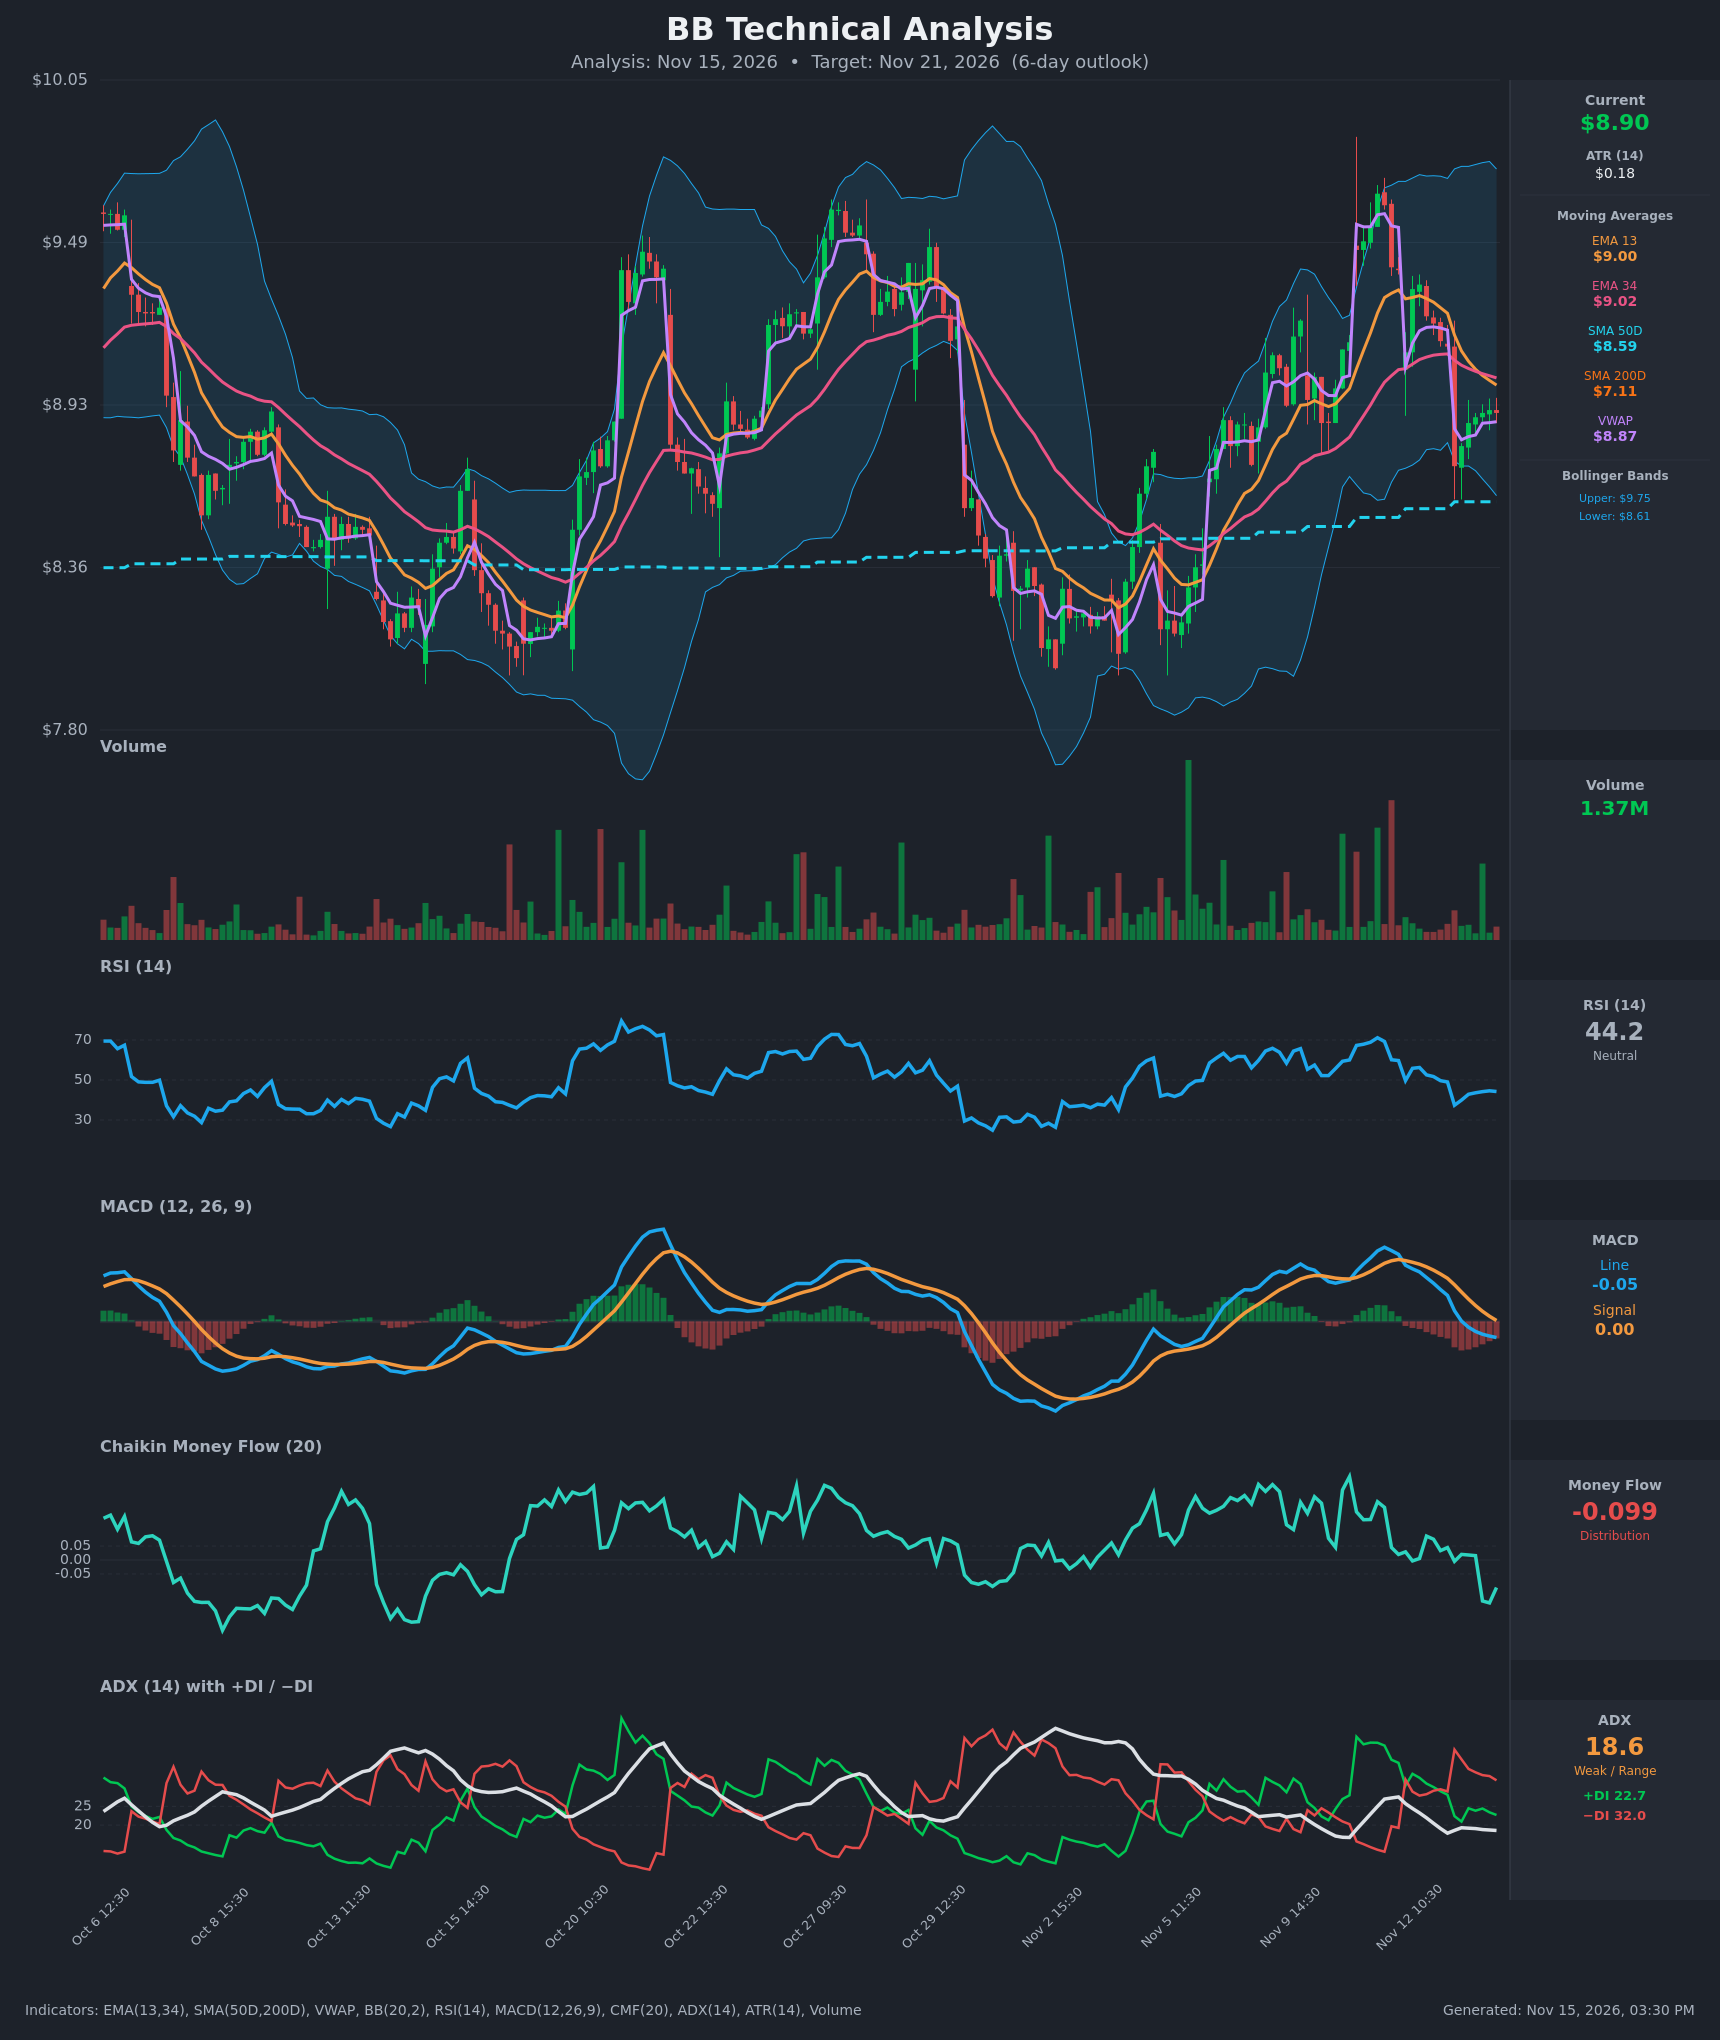
Analysis
TECHNICAL INDICATORS
- RSI (14): 44.24, below the 50 midline and recovering only slightly from 37.4 on Nov 13. It has been flat at 44 for the last few bars. Momentum is soft but not oversold. [Bearish]
- 20 EMA: The chart shows EMA 13 at $8.9966 and EMA 34 at $9.0215. Price at $8.90 sits below both, so they act as overhead resistance. EMA13 crossed below EMA34 on Nov 13 (13:30), a fresh bearish crossover. [Bearish]
- MACD: The line at -0.0511 crossed below the signal at 0.0028 on Nov 13 (about 11:30). The histogram is negative at roughly -0.054 but shrinking in the last few bars. Momentum is bearish with a hint of fading downside pressure. [Bearish]
- Bollinger Bands (20): Upper band $9.7457, lower band $8.6132, so the middle band is about $9.18. Price at $8.90 is in the lower half, roughly 25% of the band width above the lower band. The bands are wide, so volatility is elevated. Price is below the midline, which favors sellers, and the lower band is near $8.61. [Bearish]
- CMF (20): -0.099, below the -0.05 threshold, after a sharp drop from positive readings on Nov 13 (13:30). It indicates distribution, and it ticked up slightly from -0.154. [Distribution]
- ADX (14): 18.6, below 20, so the trend is weak or range-bound. −DI at 32.0 is above +DI at 22.7, so bears hold control, but without a strong trend. [Weak Trend, Bearish lean]
- Volume: 1.37M, average to below average, with no capitulation spike and no strong conviction on the recent bounce. The large red volume bar on the Nov 13 gap-down shows selling pressure. [Neutral to Bearish]
Additional context:
- SMA50D: $8.592 sits about 3.5% below price and is the nearest major support.
- SMA200D: $7.11 is far below, so the long-term trend remains up.
- VWAP: $8.8695 sits just below price, a mild positive.
DIVERGENCES & TRENDS
- There is no clear divergence. RSI at 44 and price near $8.90 are consistent with each other.
- The Nov 13 open gapped down from $9.13 to $8.72, and RSI fell from 49 to 37. Price has since recovered modestly to $8.90 while RSI only reached 44, which shows a weak bounce.
- The EMA13/EMA34 bearish cross and MACD signal cross both occurred within the last day.
- CMF fell from roughly +0.04 to -0.10, so volume-weighted flow has turned negative.
- ADX has fallen from 27.5 to 18.6, so the up-move that peaked near $9.50 has lost its trend strength, and the DI cross to −DI above +DI happened on Nov 13.
- The longer-term chart shows a repeated range between about $8.05 and $9.55 since early October. Price is now in the middle-lower part of that range.
CHART PATTERNS
- The long-term chart shows a broad range between about $8.10 and $9.55, with a lower high around $9.55 versus the Oct 29 peak. This resembles a loose Bearish Double Top or Triple Top (reference diagram, top row) at about $9.5 across Oct 20, Oct 27, and Nov 10. The pattern is not confirmed, because the neckline near $8.10–$8.20 has not been broken.
- Short-term, the bounce from $8.72 to $8.90 on shrinking volume looks like a small Bearish Flag/Pennant (continuation pattern) under the EMAs. Flag-style projections suggest a retest of $8.60–$8.70, near the lower Bollinger Band and the SMA50D.
- Over a 6-day horizon, the range structure caps upside near the EMA cluster at $9.00–$9.02, and the downside is anchored by the SMA50D at $8.59.
POTENTIAL SCENARIOS
- Scenario 1: Bearish Pullback to SMA50D — Price fails at the EMA13/34 cluster near $9.00 and drifts lower as MACD, DI, and CMF remain negative. Trigger: rejection at $9.00 or a break below VWAP at $8.87. Target: $8.60–$8.65 (SMA50D and lower Bollinger Band). Invalidation: close above $9.05 on rising volume. (50% probability)
- Scenario 2: Neutral Range Chop — ADX below 20 suggests a lack of trend, and price oscillates between $8.65 and $9.05 with no resolution. Trigger: price holds above $8.75 but cannot clear the EMAs. Target: $8.85–$8.95. Invalidation: close below $8.60 or above $9.10. (30% probability)
- Scenario 3: Bullish Recovery — Price reclaims the EMAs as RSI moves above 50 and MACD histogram turns positive, retesting the $9.20–$9.40 area. Trigger: close above $9.03 with volume above 2M. Target: $9.25–$9.35 (Bollinger midline and prior highs). Invalidation: fall back below $8.80. (20% probability)
PRICE TARGETS
For the 6-day timeframe (Nov 21, 2026), the range width is ~7% of price (target 4–8% for 7–10 days, so 6 days sits near the lower end).
- Target Price: $8.76
- Expected Range: $8.45 to $9.10 (width $0.65, about 7.3% of current price)
- Key Levels: Support at $8.59, Resistance at $9.02
OVERALL BIAS
OVERALL BIAS: BEARISH - Price is below both EMAs after a fresh bearish EMA cross, MACD is below its signal, −DI leads +DI, and CMF shows distribution. The weak ADX and the SMA50D at $8.59 limit the downside, so the expected decline is modest.
This is educational analysis and not financial advice.