BB 4-day bearish forecast — Nov 15, 2026
- Bias: Bearish
- Timeframe: 4 days (made Nov 15, 2026, target date Nov 18, 2026)
- Price at analysis: $8.90
- Price target: $8.78
- Expected range: $8.58 – $9.02
- Result: Pending — graded after the close on Nov 18, 2026
Get a free AI analysis of BB today
Analysis
TECHNICAL INDICATORS
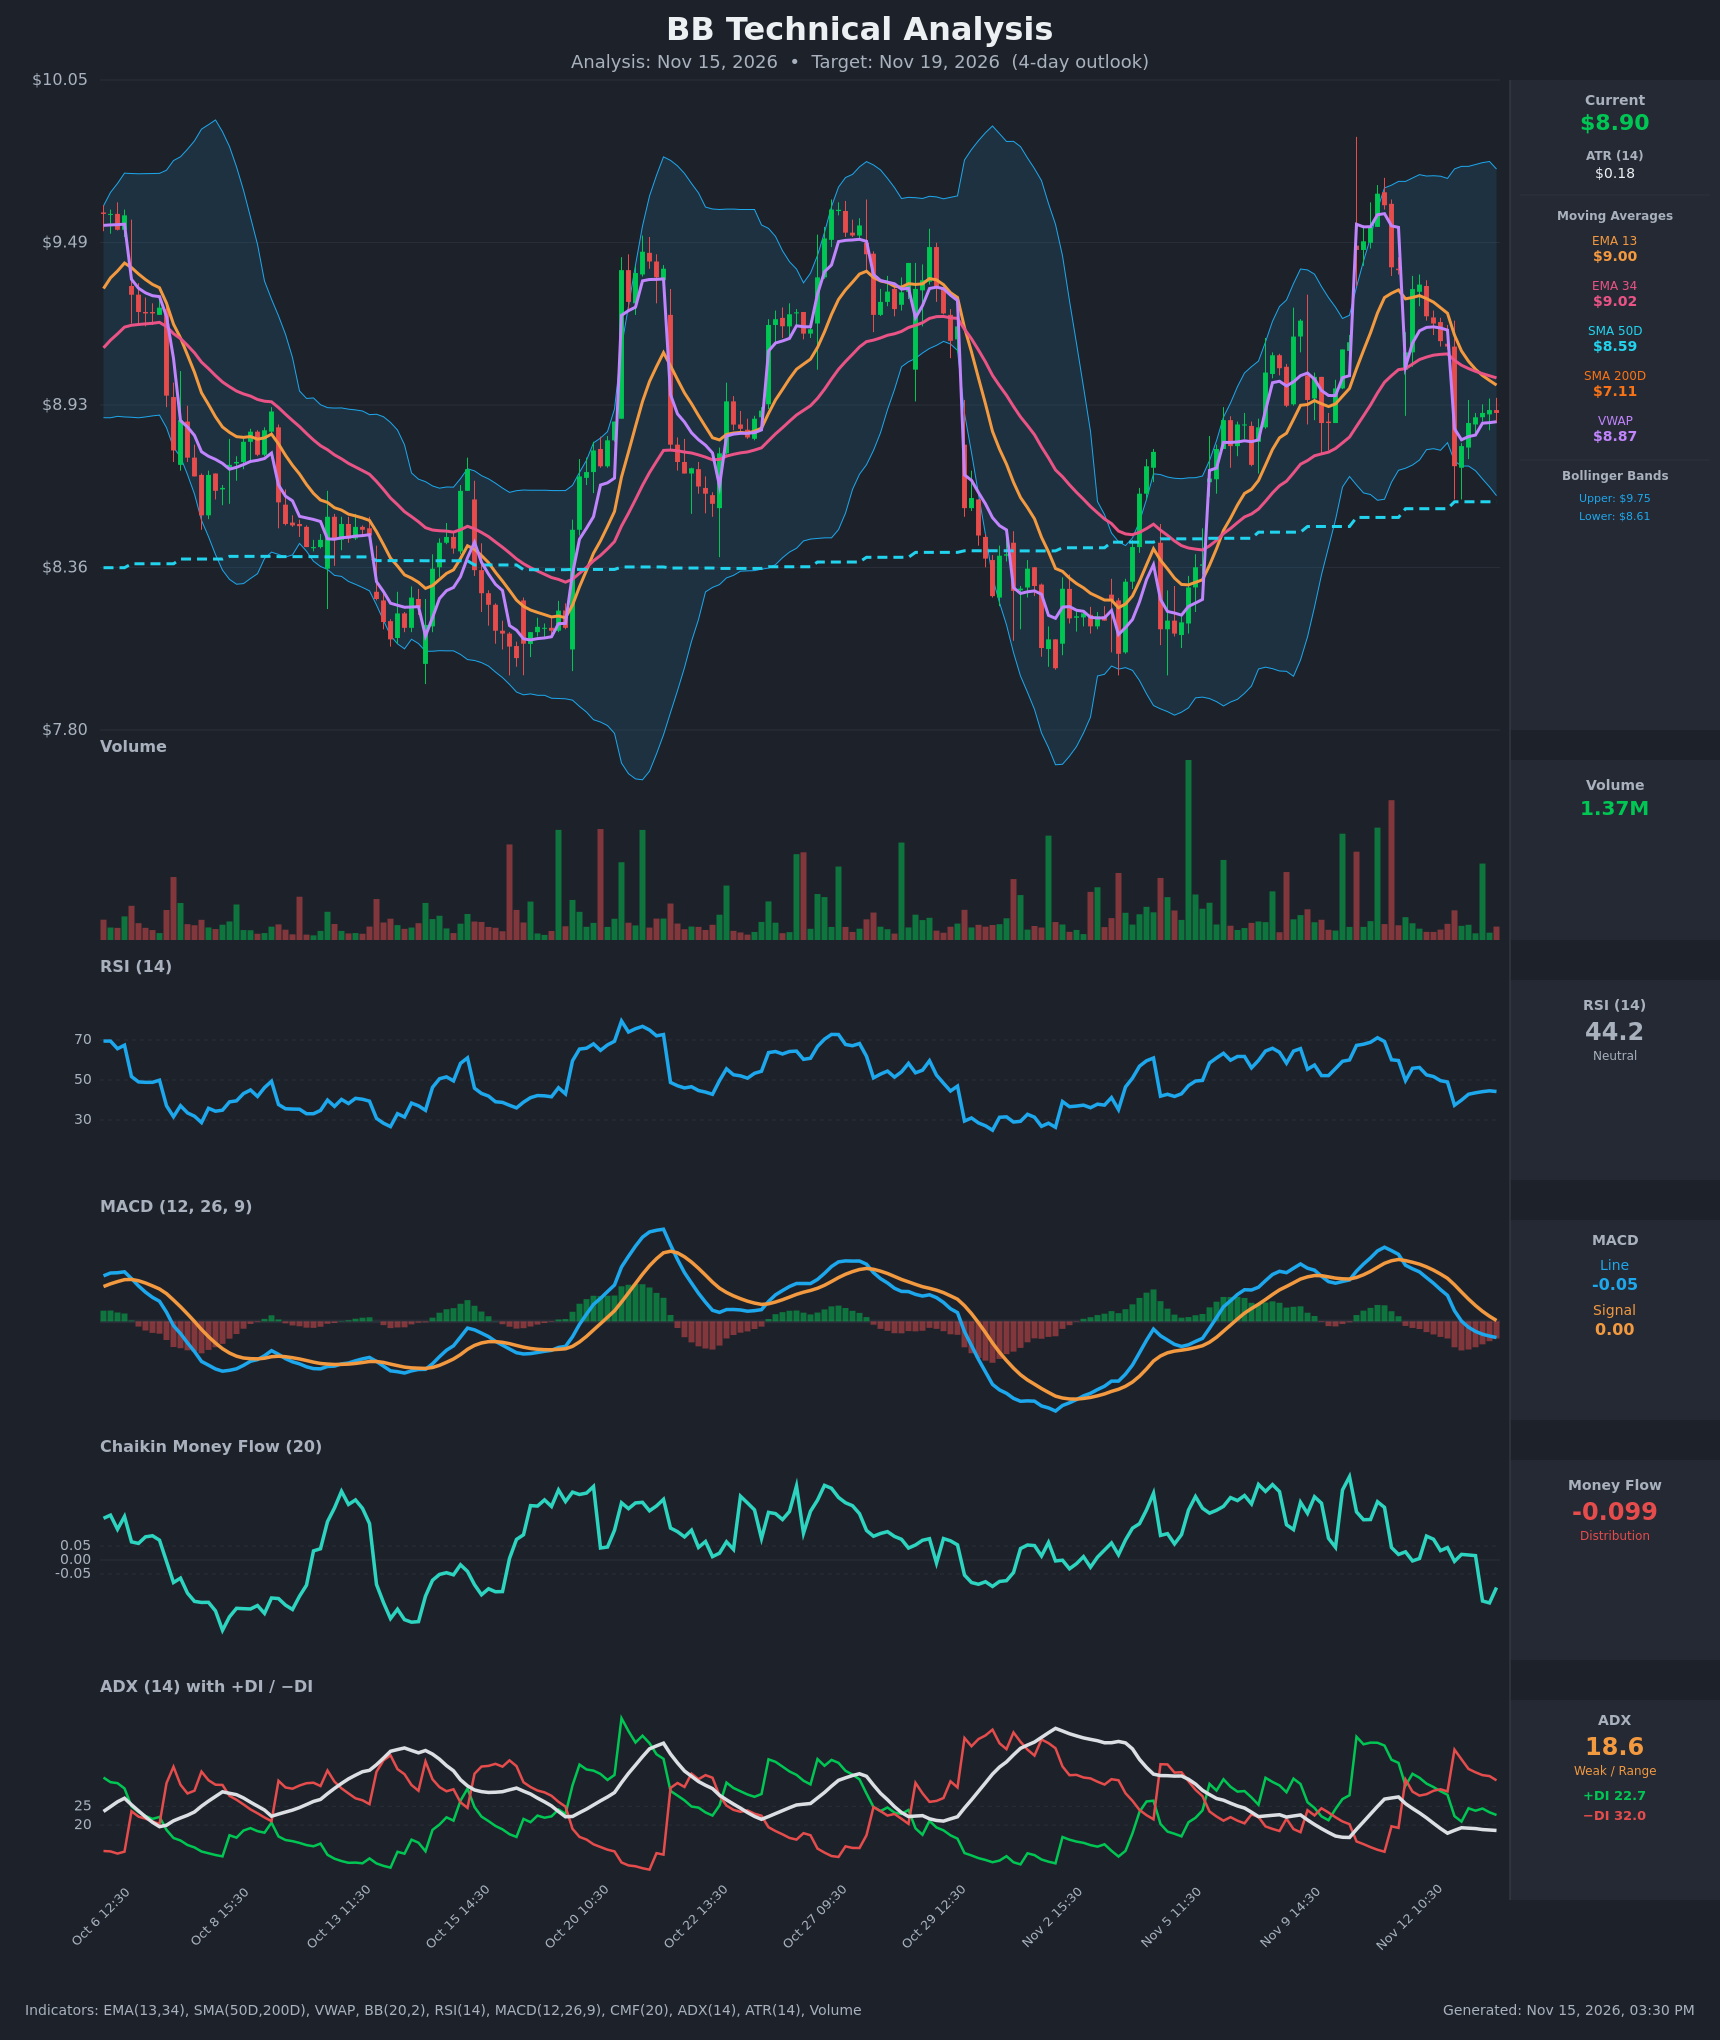
- RSI (14): 44.24, below the 50 midline and recovering only slightly from the 37.4 low on Nov 13. It is not oversold and has been stuck in the low-to-mid 40s for the last several bars, so there is no strong bounce momentum. [Bearish]
- 20 EMA: The chart supplies EMA 13 ($9.00) and EMA 34 ($9.02) instead. Price at $8.90 sits below both, and the EMA13 has just crossed below the EMA34 (9.00 vs 9.02), a fresh short-term bearish cross. Both averages are now overhead resistance around $9.00-$9.02. [Bearish]
- MACD: The line (-0.051) has crossed below the signal (+0.003) and is negative. The histogram is negative and has been expanding for several sessions. The line is also pulling away from the signal, so downside momentum has not yet turned. [Bearish]
- Bollinger Bands (20): Upper $9.75, lower $8.61, so the bands are wide. Price is in the lower half, below the midline (about $9.18), and about $0.29 above the lower band. The wide bands show recent volatility and leave room for further downside toward the lower band. [Bearish]
- CMF (20): -0.099, below the -0.05 threshold. It fell from near zero to negative during the Nov 13 selloff, which points to distribution and persistent selling pressure. [Distribution]
- ADX (14): 18.6, below 20, so there is no strong trend. −DI (32.0) is clearly above +DI (22.7), so bears have the edge. A weak trend with a bearish tilt suggests a choppy drift lower rather than a sharp decline. [Weak Trend, bearish lean]
- Volume: 1.37M, subdued compared with the spikes on the large up and down moves. The rebound from $8.72 to $8.90 came on light volume, so buyers are not showing conviction. [Weak rebound / Bearish lean]
Other levels:
- VWAP: $8.87, just below price, so it is the immediate intraday pivot.
- SMA50D: $8.59, a key support zone that coincides with the lower Bollinger Band.
- SMA200D: $7.11, far below, so the long-term trend is still up.
DIVERGENCES & TRENDS
- There is no clear RSI or MACD divergence. RSI and MACD both made lower highs on the Nov 10-11 push versus the early-November peak, which is consistent with fading upside momentum.
- The MACD bearish crossover (the line crossed below the signal around Nov 13 10:30) is confirmed by a −DI over +DI cross, CMF turning negative, and the EMA13 falling under the EMA34.
- The Nov 13 open gapped down from $9.13 to $8.72, and the bounce since then has been shallow and capped near $8.91.
- Price is above the SMA50D and well above the SMA200D, so the larger structure is not broken. A death cross is not in play, since the SMA50D is far above the SMA200D.
- ADX is falling (27.5 to 18.6), so the prior uptrend has lost strength and the market is moving to a range.
CHART PATTERNS
- Bearish Flag / Pennant (continuation): After the sharp drop from $9.13 to $8.72, price has formed a small, low-volume, gently rising consolidation around $8.72-$8.91. A break below about $8.75 would suggest a measured move of roughly $0.40 toward the $8.60 area, which matches the SMA50D and lower Bollinger Band.
- Loose Bearish Double Top: Peaks near $9.55-$9.60 (late October and Nov 10) show repeated rejection at the upper zone. The neckline is far lower, around $8.1-$8.2, so this is background context rather than an active trigger.
- Range structure: The broader chart oscillates between roughly $8.1 and $9.6, and the current price is in the lower-middle of that range.
POTENTIAL SCENARIOS
- Scenario 1: Bearish Flag Breakdown — Price fails at the EMA13/34 cluster, MACD stays negative, and −DI stays dominant, so price drifts down toward the SMA50D and lower Bollinger Band. Trigger: a close below $8.72-$8.75 or below VWAP at $8.87 on rising volume. Target: $8.60-$8.65. Invalidation: a close above $9.02 on solid volume. (50% probability)
- Scenario 2: Neutral Chop Around VWAP — With ADX below 20, price stays pinned between $8.72 and $9.00 with no clear direction. Trigger: low volume and RSI holding in the 40-50 zone. Target: $8.80-$8.95. Invalidation: a close outside $8.70-$9.03. (20% probability)
- Scenario 3: Bullish Relief Bounce — A dead-cat or mean-reversion bounce reclaims the EMAs, with CMF recovering above zero. Trigger: a break above $9.02 with volume above 2M. Target: $9.20-$9.30. Invalidation: a close back below $8.80. (30% probability)
PRICE TARGETS
For a 4-day horizon, the Expected Range width is about $0.44, or roughly 4.9% of the current price, which is appropriate for this timeframe (wider than a 2-3 day range).
- Target Price: $8.78 (4 days)
- Expected Range: $8.58 to $9.02
- Key Levels: Support at $8.59, Resistance at $9.02
OVERALL BIAS
OVERALL BIAS: BEARISH - The MACD is below its signal line and negative, −DI dominates +DI, CMF shows distribution, and price sits below the freshly crossed-down EMA13/34. The weak, low-volume bounce looks like a bearish flag, so a drift toward the $8.60 SMA50D support is more likely than a reclaim of $9.02. Because ADX is below 20, any decline is likely to be gradual rather than sharp.
This is educational analysis and not financial advice.