QCOM 6-day bearish forecast — Nov 15, 2026
- Bias: Bearish
- Timeframe: 6 days (made Nov 15, 2026, target date Nov 20, 2026)
- Price at analysis: $172.39
- Price target: $170.50
- Expected range: $166.00 – $176.50
- Result: Pending — graded after the close on Nov 20, 2026
Get a free AI analysis of QCOM today
Analysis
TECHNICAL INDICATORS
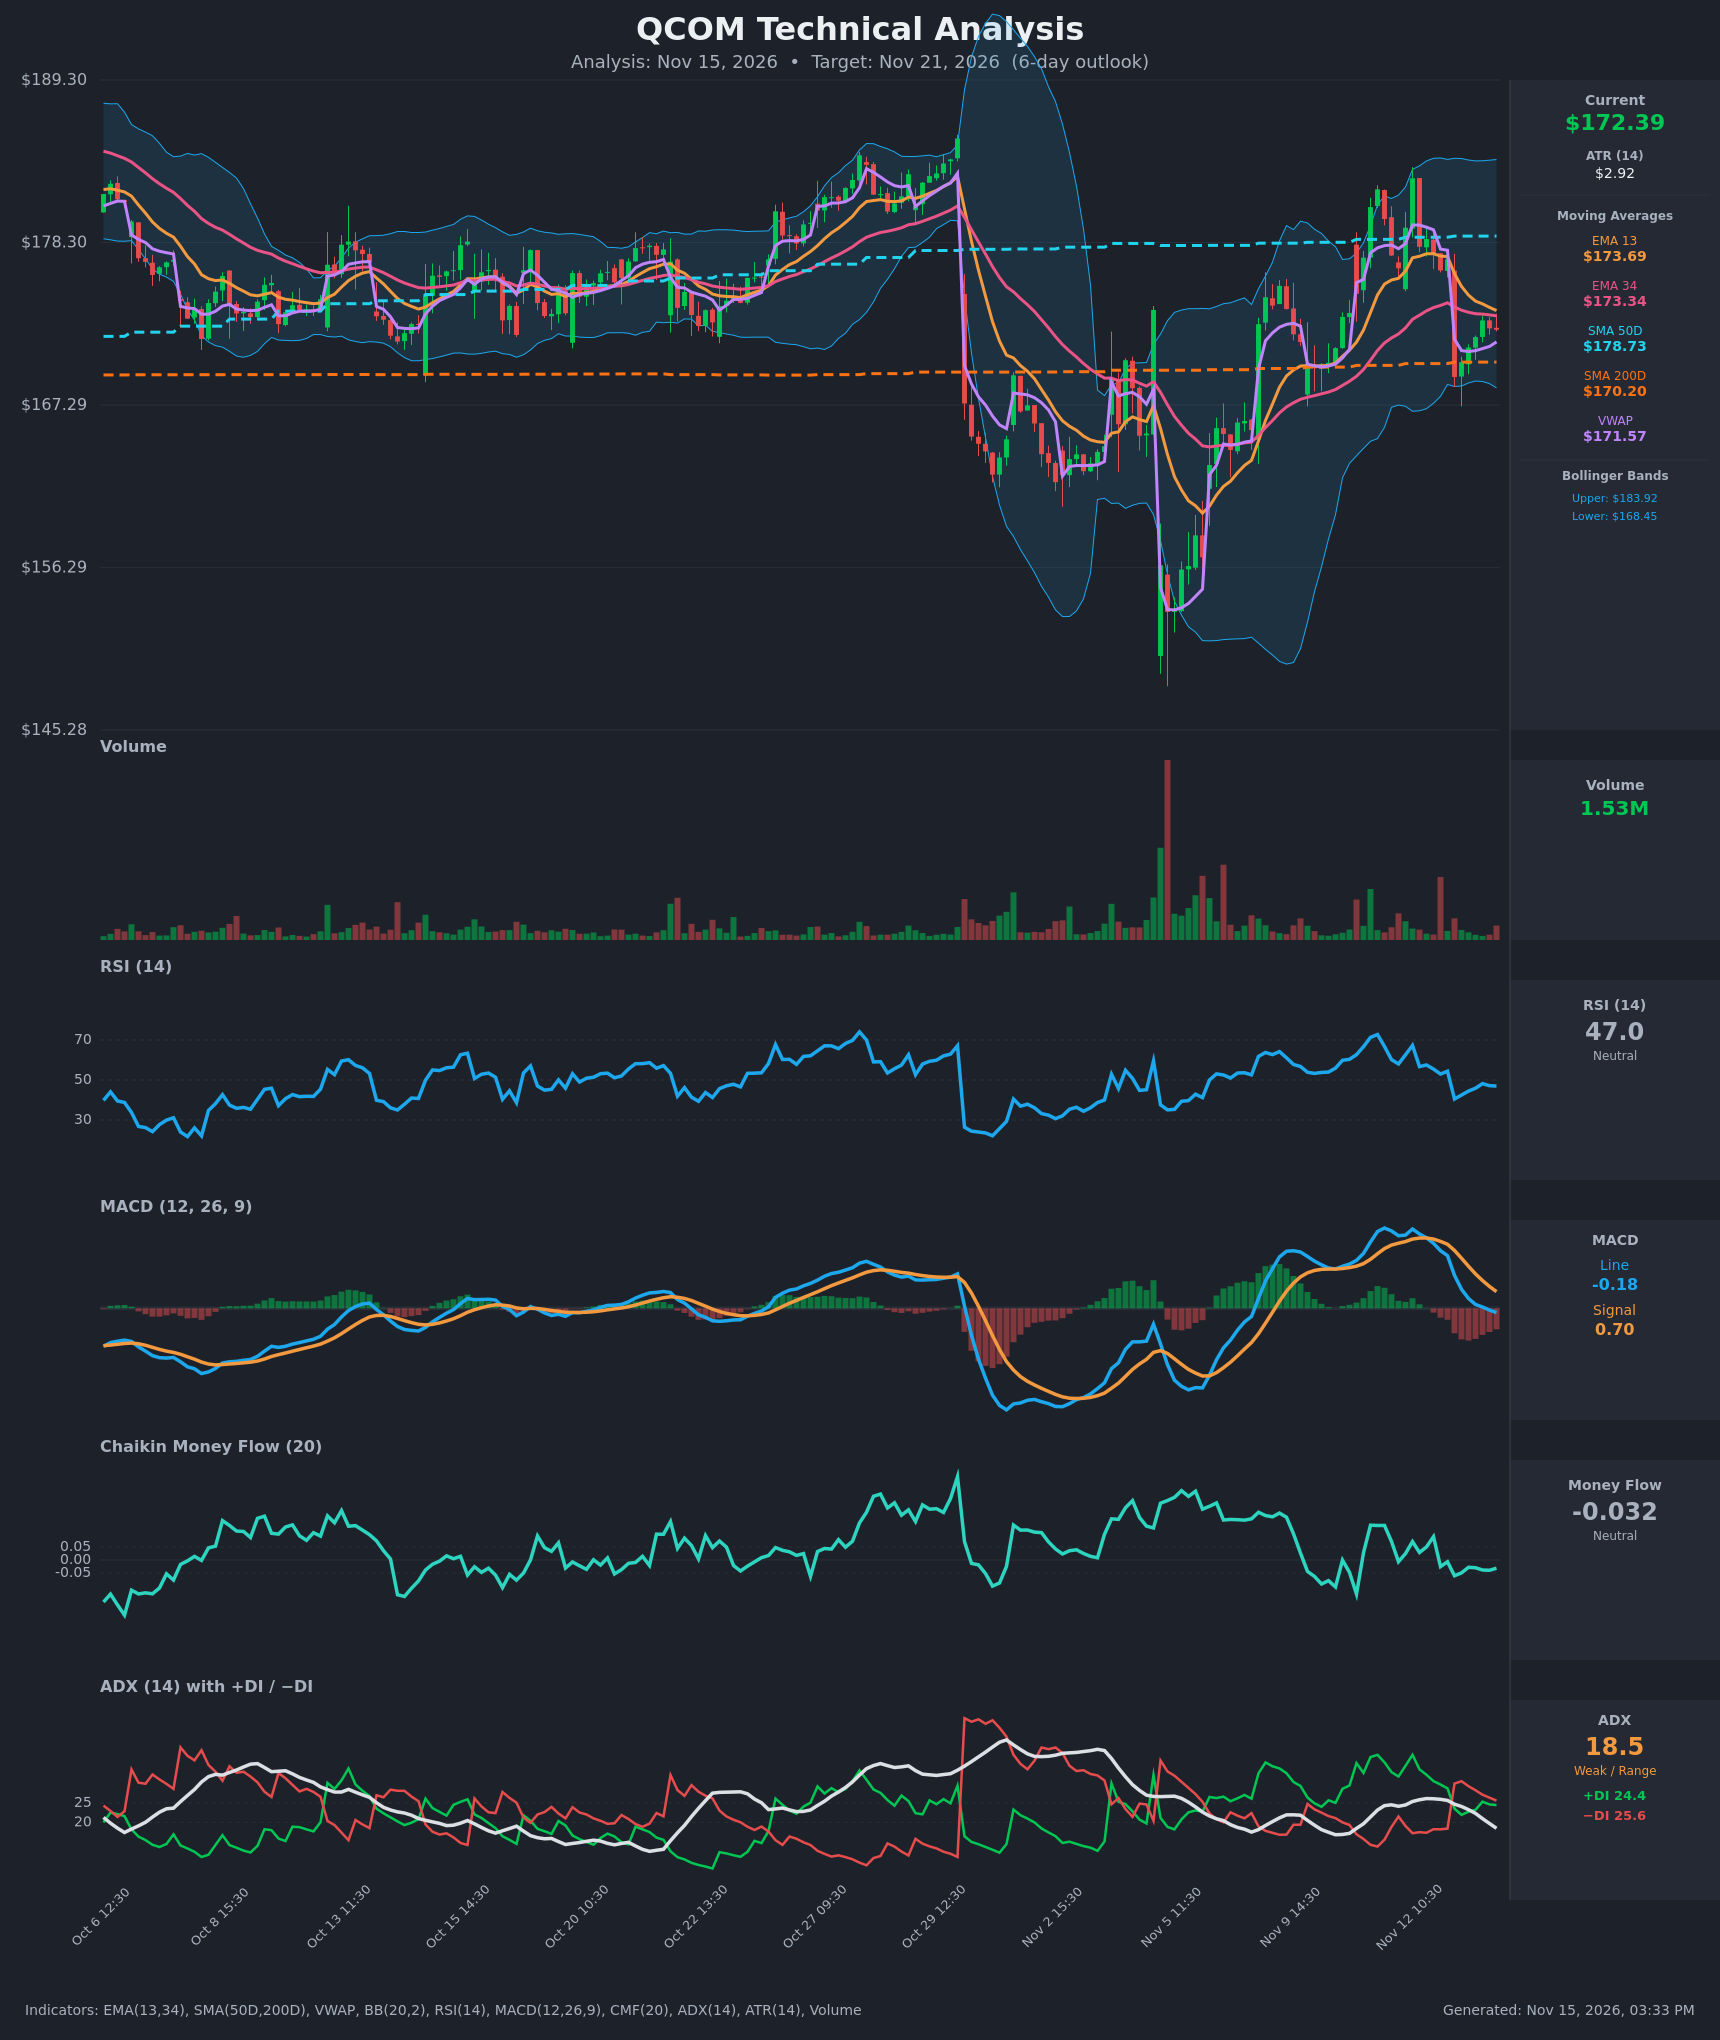
- RSI (14): 46.97, just below the 50 midline. It dropped from 67 on Nov 12 to 40.5 after the Nov 13 gap-down, then recovered to the mid-40s and has stalled, with no overbought or oversold signal. [Neutral]
- 20 EMA: The chart shows EMA 13 at $173.69 and EMA 34 at $173.34. Price at $172.39 is below both, and EMA 13 has been falling from $177.54 and is now converging on EMA 34. Both act as overhead resistance. [Bearish]
- MACD: Line -0.18 against signal 0.70, with a negative and widening histogram. The line crossed below the signal around Nov 12 15:30–Nov 13 and has just gone below zero, which is a bearish momentum shift. [Bearish]
- Bollinger Bands (20): Upper $183.92, lower $168.45, midline about $176.2. Price sits in the lower half of the bands (%B ≈ 0.25), below the mid-band. The bands are wide after the recent volatility, so there is room for a move either way, but the midline is acting as a ceiling. [Bearish]
- CMF (20): -0.032, inside the ±0.05 neutral zone. It has slipped from +0.09 on Nov 12 to slightly negative and is flat during the bounce. This shows no accumulation behind the recovery. [Neutral]
- ADX (14): 18.5 and falling, which signals a weak, range-bound trend. −DI (25.6) is just above +DI (24.4) after the Nov 13 bearish DI crossover, but the spread is tiny. [Weak Trend, slight bearish tilt]
- Volume: 1.53M on the latest bar, which is average to below average. The bounce off the $169 gap-down low came on unremarkable volume, so there is no strong dip-buying conviction. [Neutral to mildly bearish]
DIVERGENCES & TRENDS
- There is no clear price/RSI divergence. RSI fell from 67 to 40 and recovered only to 47, so momentum is lagging the price recovery.
- MACD has completed a bearish signal-line crossover and is now below zero, and the histogram is getting more negative.
- The EMA 13/34 gap is nearly closed (173.69 vs 173.34). A bearish EMA cross is likely within a few sessions if price stays below $173.3.
- Price is above SMA200 ($170.20) and above VWAP ($171.57), which supports the long-term floor. It is well below SMA50 ($178.73), which is falling or flat and caps rallies.
- ADX is trending down toward 18, so the market is drifting into a range rather than a strong trend. The two DI lines are intertwined.
- The Nov 13 gap-down from about $177 to $169 has been only partly filled. Price retraced to roughly $173 and has since rolled over.
CHART PATTERNS
- Bearish Flag / Pennant (tentative): After the sharp gap-down, price has made a low-volume, slightly upward-sloping consolidation below the EMAs. If it breaks below about $171.5–$170.2, the measured move points toward $168–$166. It is not confirmed yet.
- Broader range: Over several weeks, price has traded between roughly $168 and $183 above SMA200. This is a wide consolidation, and $168–$170 is the key demand zone. A failure there would invalidate the range and open the downside toward the $160s.
- Lower high structure: The $182.65 spike on Nov 12 was rejected at once, so the near-term high is lower than the earlier push toward $183–$184.
POTENTIAL SCENARIOS
- Scenario 1: Bearish Rollover to SMA200 Support — Price fails at the EMA 13/34 cluster, the MACD stays below its signal, and price drifts toward the SMA200 and the lower Bollinger Band. Trigger: rejection at $173.3–$173.7 and a close below the VWAP at $171.57. Target: $168.50–$170.20, with an extension to about $166 on an SMA200 break. Invalidation: a daily close above $174.5, which reclaims both EMAs. (45% probability)
- Scenario 2: Bullish Reclaim of EMAs — Buyers defend the SMA200 and VWAP, price clears the EMAs, and the move fills part of the gap. Trigger: a hourly close above $174.0 with MACD histogram turning up and CMF moving above +0.05. Target: $176.0–$177.5 (Bollinger midline and the gap area). Invalidation: a close below $170.20. (35% probability)
- Scenario 3: Neutral Chop Around the Moving Averages — With ADX below 20, price oscillates between $170 and $174 around the EMAs and VWAP. Trigger: no break of either $170.20 or $174. Target: $171–$173.5. Invalidation: a close outside the $169.5–$175 band. (20% probability)
PRICE TARGETS
- Target Price: $170.50 (6-day horizon)
- Expected Range: $166.00 to $176.50 (width $10.50, about 6.1% of current price, consistent with the 4–8% guide for 6–10 days)
- Key Levels: Support at $170.20 (SMA200), Resistance at $173.69 (EMA 13)
OVERALL BIAS
OVERALL BIAS: BEARISH - Price is below both EMAs and rolling over from them, MACD has crossed bearish and is widening below the signal, and the recovery from the gap-down has come on weak volume with neutral CMF. Weak ADX limits conviction, and the SMA200 at $170.20 is the key support to watch.
This is educational analysis and not financial advice.