QCOM 4-day bearish forecast — Nov 15, 2026
- Bias: Bearish
- Timeframe: 4 days (made Nov 15, 2026, target date Nov 18, 2026)
- Price at analysis: $172.39
- Price target: $170.80
- Expected range: $167.90 – $175.70
- Result: Pending — graded after the close on Nov 18, 2026
Get a free AI analysis of QCOM today
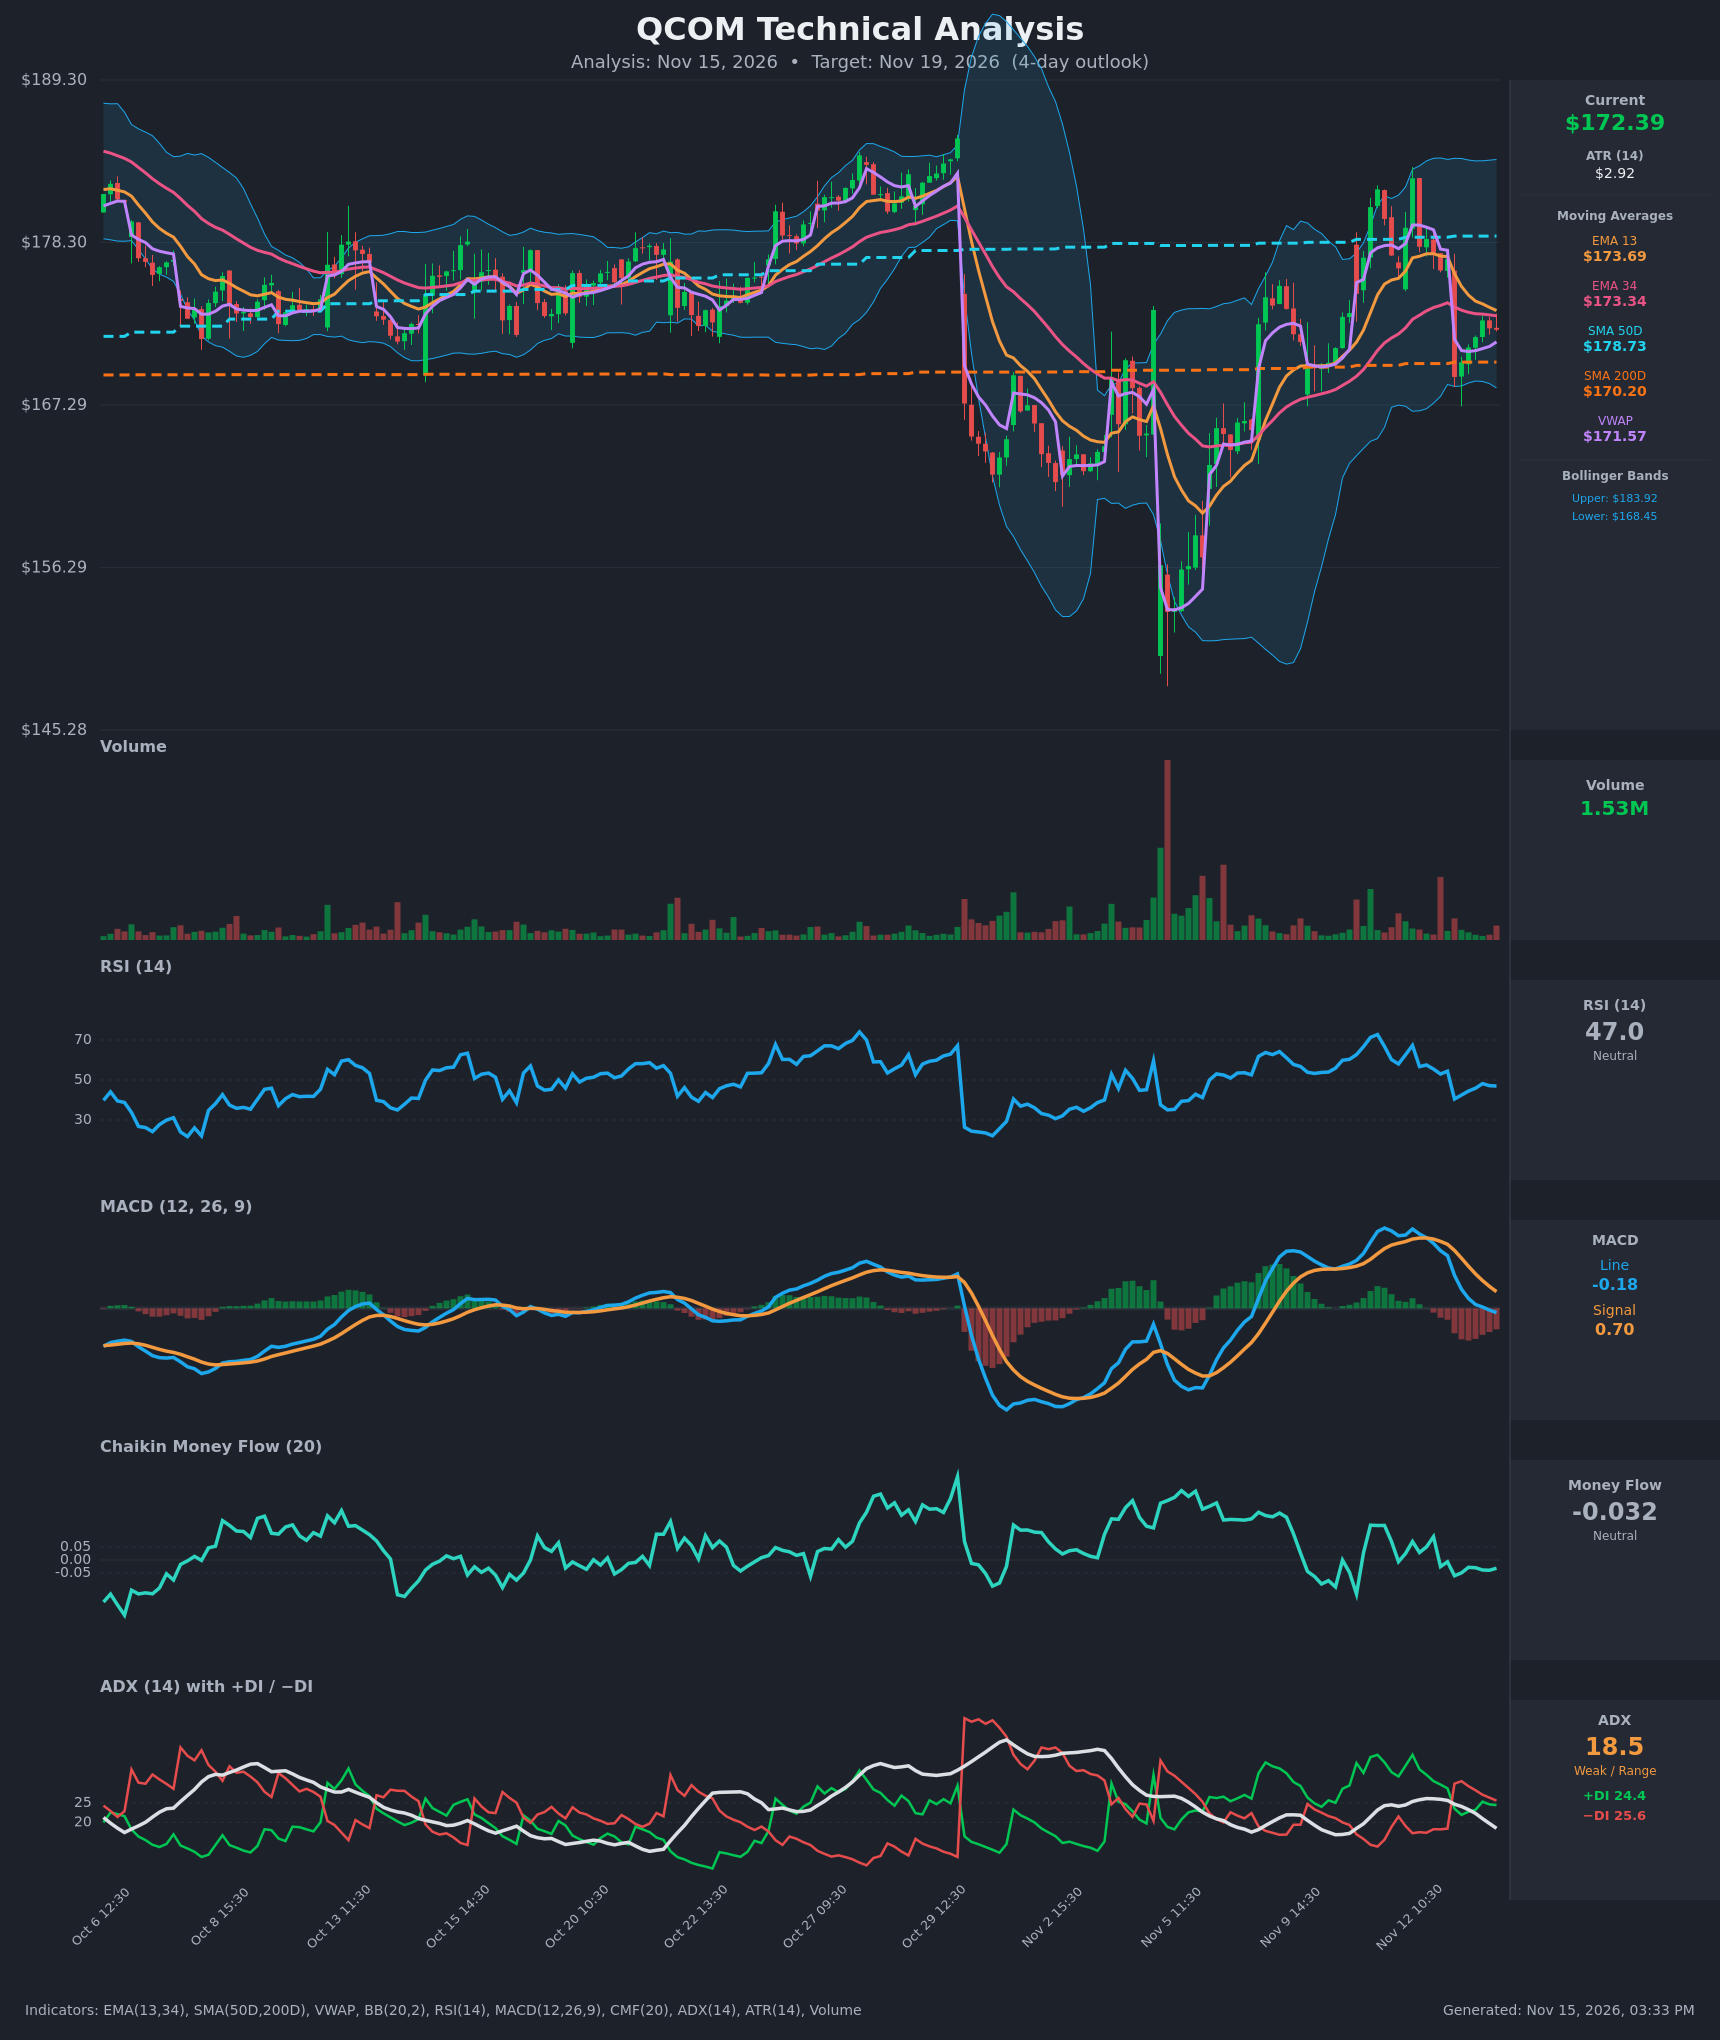
Analysis
TECHNICAL INDICATORS
- RSI (14): 46.97, just under the 50 midline. It fell from 67 on Nov 12 to 40.5 after the Nov 13 gap down, then recovered only to the mid-40s and has stalled. There is no oversold or overbought signal, and momentum is flat to slightly soft. [Neutral]
- 20 EMA (EMA 13 / EMA 34 used): EMA13 is $173.69 and EMA34 is $173.34. Price at $172.39 is below both, so they act as overhead resistance. EMA13 has fallen from $177.54 and is nearly touching EMA34, so a bearish EMA cross is close. [Bearish]
- MACD: The line is -0.18 and the signal is +0.70. The line crossed below the signal on Nov 13 and has since crossed below zero. The histogram is negative (about -0.88) but has stopped widening quickly. This is a fresh bearish crossover. [Bearish]
- Bollinger Bands (20): Upper is $183.92 and lower is $168.45, with price at $172.39, a little below the midline (about $176). The bands are wide after the earlier volatility, so there is room in both directions. Price is in the lower half and the Nov 13 low near $169 held near the lower band. [Neutral]
- CMF (20): -0.032 sits inside the ±0.05 neutral zone, but it has drifted negative and stayed there since the Nov 13 gap. That points to mild distribution, not strong selling. [Neutral]
- ADX (14): 18.5 and falling from 26, so the trend is weak. −DI (25.6) is just above +DI (24.4), after a bearish DI crossover on Nov 13. The market is range-bound with a slight bearish tilt. [Weak Trend, slight Bearish]
- Volume: 1.53M, below the spikes seen on the Nov 13 gap. The recovery bounce is on light volume, so buyers are not showing conviction. [Bearish-leaning, low-conviction bounce]
- Other levels: Price is above SMA200 ($170.20), which keeps the long-term structure intact, and above VWAP ($171.57) by a small margin. It is well below SMA50 ($178.73), which is far overhead resistance.
DIVERGENCES & TRENDS
- No clear divergence. RSI (47) and price (below the short EMAs) agree with each other.
- The MACD bearish crossover and the −DI/+DI flip both occurred at the Nov 13 gap-down. Momentum has turned down from the Nov 12 peak at $182.65.
- ADX has dropped from 26 to 18.5, so the move is losing trend strength and the market is moving into a range.
- EMA13 is converging on EMA34 and is about to cross down. SMA50 ($178.73) is above SMA200 ($170.20), so there is no death cross, but the gap is narrow.
- The bounce from $169.20 to about $173 has failed to reclaim the EMAs. The last two closes are lower highs ($173.02, then $172.49 and $172.39).
CHART PATTERNS
- Bearish Flag / Rising Channel (continuation): After the sharp drop from $182.65 to $169.20, price is drifting up in a small, low-volume channel. This matches the Bearish Flag in the diagram. A textbook measured move would be the roughly $13 pole, but that is unlikely within 4 days.
- Realistic downside: The $170.20 SMA200, $169.20 (the Nov 13 low) and the $168.45 lower Bollinger Band form a support cluster. That cluster is the practical target zone for this timeframe.
- Invalidation: A close above $174 (above EMA13 and EMA34) would negate the flag and suggest a range or a bullish retest of $176–178.
- Context: The broader chart is a wide range between about $168 and $183, and the weak ADX supports range behavior.
POTENTIAL SCENARIOS
- Scenario 1: Bearish Flag Breakdown — Price fails at the EMA13/EMA34 cluster, the EMAs cross down, and sellers push price back to the SMA200 and the Nov 13 low. Trigger: loss of VWAP ($171.57) and a close below $170.80. Target: $169.00–$170.20, with an extension to $168.45. Invalidation: close above $174.00. (45% probability)
- Scenario 2: Bullish Relief Rally — Price holds above SMA200 and VWAP, RSI recovers above 50, and price reclaims the EMAs. Trigger: close above $173.70. Target: $176.00–$177.50 (the gap area and mid-band). Invalidation: close below $169.20. (30% probability)
- Scenario 3: Neutral Range Chop — Weak ADX keeps price between SMA200 and the EMAs. Trigger: price oscillating between $170 and $174. Target: $171.50–$173.00. Invalidation: close outside $169.50–$174.50. (25% probability)
PRICE TARGETS
- Target Price: $170.80 (4-day horizon)
- Expected Range: $167.90 to $175.70 (width $7.80, about 4.5% of the current price, in line with the 4-day guidance)
- Key Levels: Support at $170.20 (SMA200; the lower Bollinger Band at $168.45 is the next support below), Resistance at $173.69 (EMA13, then EMA34 at $173.34)
OVERALL BIAS
OVERALL BIAS: BEARISH - The fresh MACD bearish crossover, the −DI/+DI flip, price below EMA13 and EMA34, and a low-volume bounce inside a bearish flag all outweigh the neutral RSI and CMF. Downside is likely cushioned by the SMA200 and the Nov 13 low, so the expected move is modest.
This is educational analysis and not financial advice.