BB 13-day bearish forecast — Nov 15, 2026
- Bias: Bearish
- Timeframe: 13 days (made Nov 15, 2026, target date Nov 27, 2026)
- Price at analysis: $8.90
- Price target: $8.75
- Expected range: $8.25 – $9.30
- Result: Pending — graded after the close on Nov 27, 2026
Get a free AI analysis of BB today
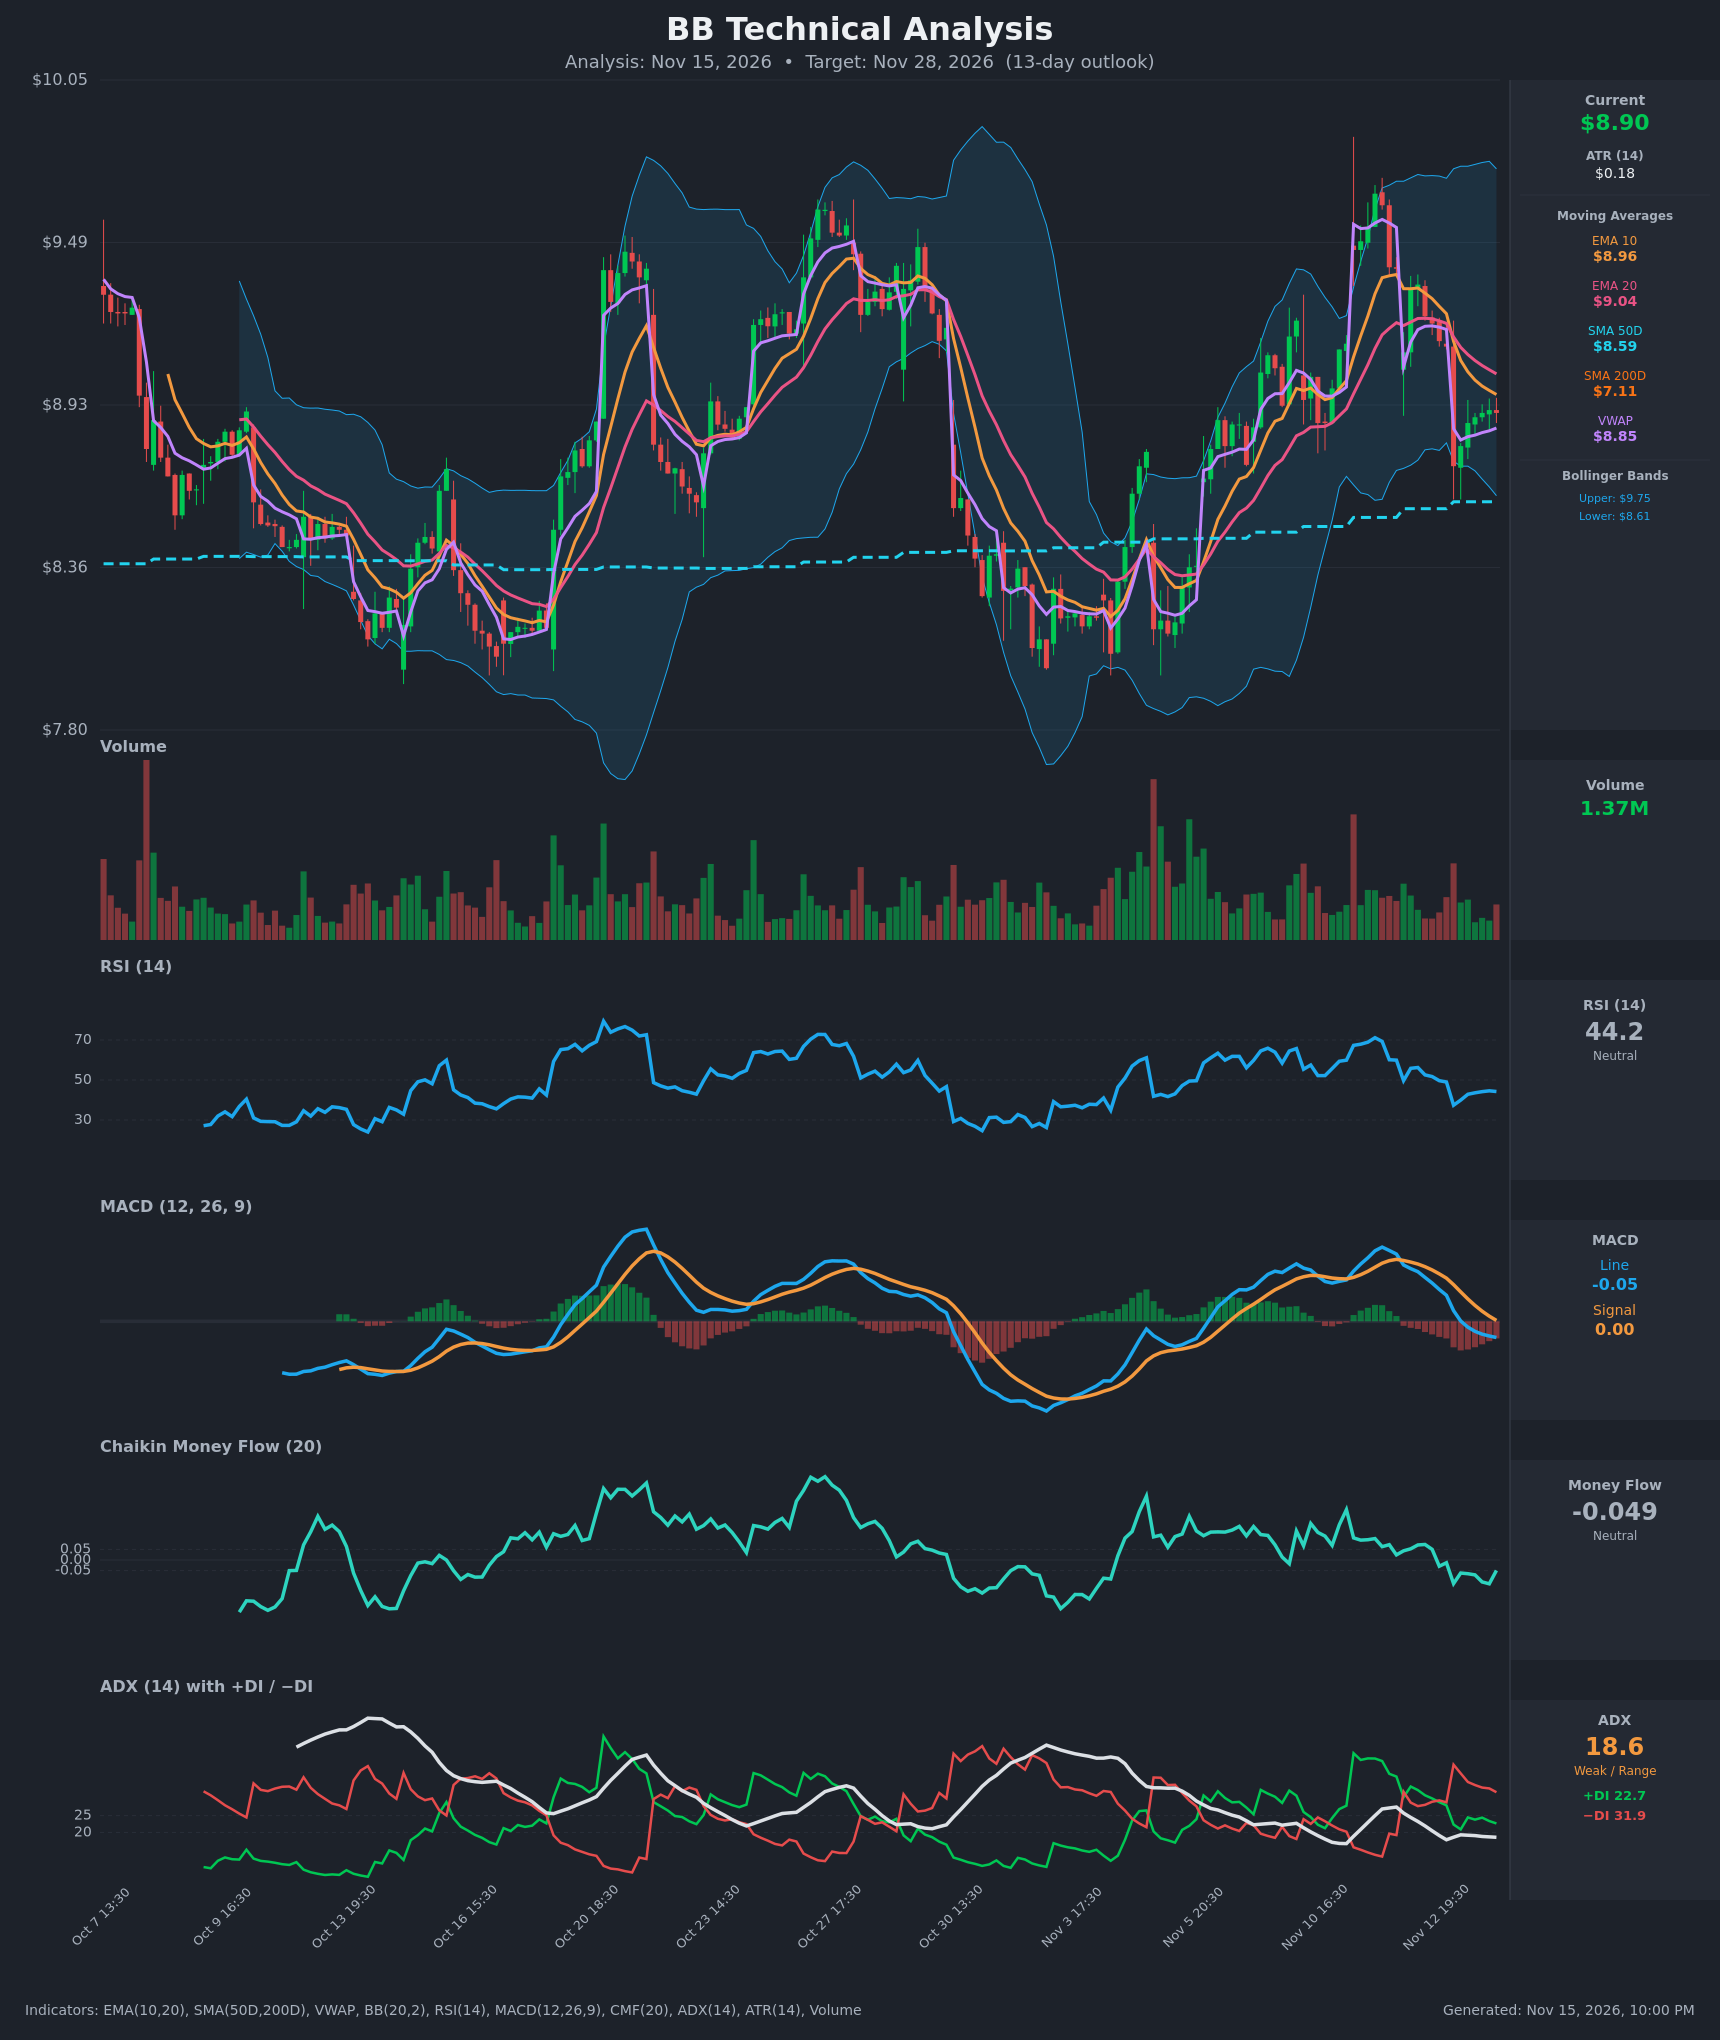
Analysis
TECHNICAL INDICATORS
- RSI (14): 44.24, down from ~60 on Nov 11 and a low of 37.4 on Nov 13. It has stabilized in the low-to-mid 40s, below the 50 midline but well above oversold. Momentum is mildly bearish and flattening. [Bearish]
- 20 EMA: $9.0354, with price at $8.90 below it. EMA10 ($8.96) has crossed below EMA20 and both are sloping down, so the EMAs act as overhead resistance. [Bearish]
- MACD: Line -0.051 is below signal 0.003, after a bearish crossover around Nov 13. The histogram is negative but its decline is slowing. Momentum is bearish, with early signs of fading downside pressure. [Bearish]
- Bollinger Bands (20): Upper $9.75, lower $8.61, midline about $9.18. Price at $8.90 sits in the lower third, about 0.29 above the lower band. The band width is wide after the recent volatility, which leaves room for a range. Price is below the midline. [Neutral]
- CMF (20): -0.049, just above the -0.05 distribution threshold. It has deteriorated from +0.07 on Nov 12 and has been mostly negative since Nov 13. Selling pressure is mild. [Neutral]
- ADX (14): 18.6, which is weak or range-bound. −DI (31.9) is above +DI (22.7), so bears have the edge, but the low ADX means there is no strong trend. [Weak Trend, Bearish lean]
- Volume: 1.37M, average to slightly below average. The Nov 13 selloff came on moderate volume with no capitulation spike. The recent bounce is on light volume, which suggests weak conviction. [Neutral/Bearish]
Other levels:
- VWAP is $8.85, just below price, a minor support.
- SMA50 is $8.59, a major support.
- SMA200 is $7.11, so price is still in a long-term uptrend.
DIVERGENCES & TRENDS
- No clear RSI or MACD divergence is visible. RSI is making slightly higher lows from 37.4 to 44.2 while price recovers, a minor sign of stabilization.
- The MACD histogram is shrinking in negative territory, but the line is still below signal with no bullish cross.
- The EMA10/EMA20 bearish crossover and the −DI over +DI cross confirm short-term weakness.
- Price is above SMA50 and SMA200, so the intermediate and long-term trend remains up, in a pullback within that trend.
- The Nov 13 gap-down from $9.13 to $8.72 produced a lower high at $9.40 and then a drop. Price is now in a tight $8.72 to $8.91 recovery range.
- CMF has rolled over from positive to slightly negative, which supports the cautious view.
CHART PATTERNS
- Since the Oct 30 low near $8.05, price has made a series of higher highs and lows ($9.40 peak on Nov 11), and the recent drop looks like a lower-high rollover. This resembles a loose Bearish Double Top, with the peaks around $9.55 (Oct 24) and $9.40 (Nov 11) and a neckline near $8.70 to $8.80. The pattern is not clean.
- The tight consolidation after the gap-down looks like a small Bearish Flag/Pennant under the EMAs. A break below $8.72 would target roughly $8.40 to $8.55.
- A break above $9.05 (EMA20) would invalidate the bearish read and open a move back toward $9.40.
- Wide-range price action between $8.05 and $9.55 over the last 6 weeks suggests range behavior, and ADX is weak.
POTENTIAL SCENARIOS
- Scenario 1: Bearish Pullback Toward SMA50 — Price rejects at the falling EMAs ($8.96 to $9.04), and the bearish MACD, −DI dominance and mild distribution push price lower toward the SMA50 area. Trigger: break below $8.72 (Nov 13 low) and VWAP at $8.85 on a closing basis. Target: $8.55 to $8.60. Invalidation: close above $9.10. (50% probability)
- Scenario 2: Neutral Range Chop — Weak ADX and wide Bollinger Bands keep price oscillating between $8.60 and $9.10. Trigger: price holds above $8.72 and fails at $9.05. Target: $8.80 to $9.00. Invalidation: close outside $8.55 to $9.15. (28% probability)
- Scenario 3: Bullish Recovery — Buyers defend the Nov 13 low, MACD histogram turns up and price reclaims the EMAs, retesting the prior high. Trigger: close above $9.05 on rising volume. Target: $9.35 to $9.45. Invalidation: loss of $8.72. (22% probability)
PRICE TARGETS
- Target Price: $8.75 (13-day)
- Expected Range: $8.25 to $9.30 (width $1.05, about 11.8% of the current price, in line with the 8-12% guidance for 14-21 days and scaled slightly down for 13 days)
- Key Levels: Support at $8.59 (SMA50, near the lower Bollinger Band at $8.61), Resistance at $9.04 (EMA20)
OVERALL BIAS
OVERALL BIAS: BEARISH - Price is below the falling EMA10 and EMA20, MACD has crossed bearish, −DI is above +DI, and CMF is slipping into distribution. The long-term uptrend above SMA50 and SMA200 limits the downside, so the expected move is a pullback toward the $8.55 to $8.60 SMA50 zone.
This is educational analysis and not financial advice.