BAC 13-day bullish forecast — Nov 15, 2026
- Bias: Bullish
- Timeframe: 13 days (made Nov 15, 2026, target date Nov 27, 2026)
- Price at analysis: $51.02
- Price target: $51.65
- Expected range: $49.50 – $53.70
- Result: Pending — graded after the close on Nov 27, 2026
Get a free AI analysis of BAC today
Analysis
TECHNICAL INDICATORS
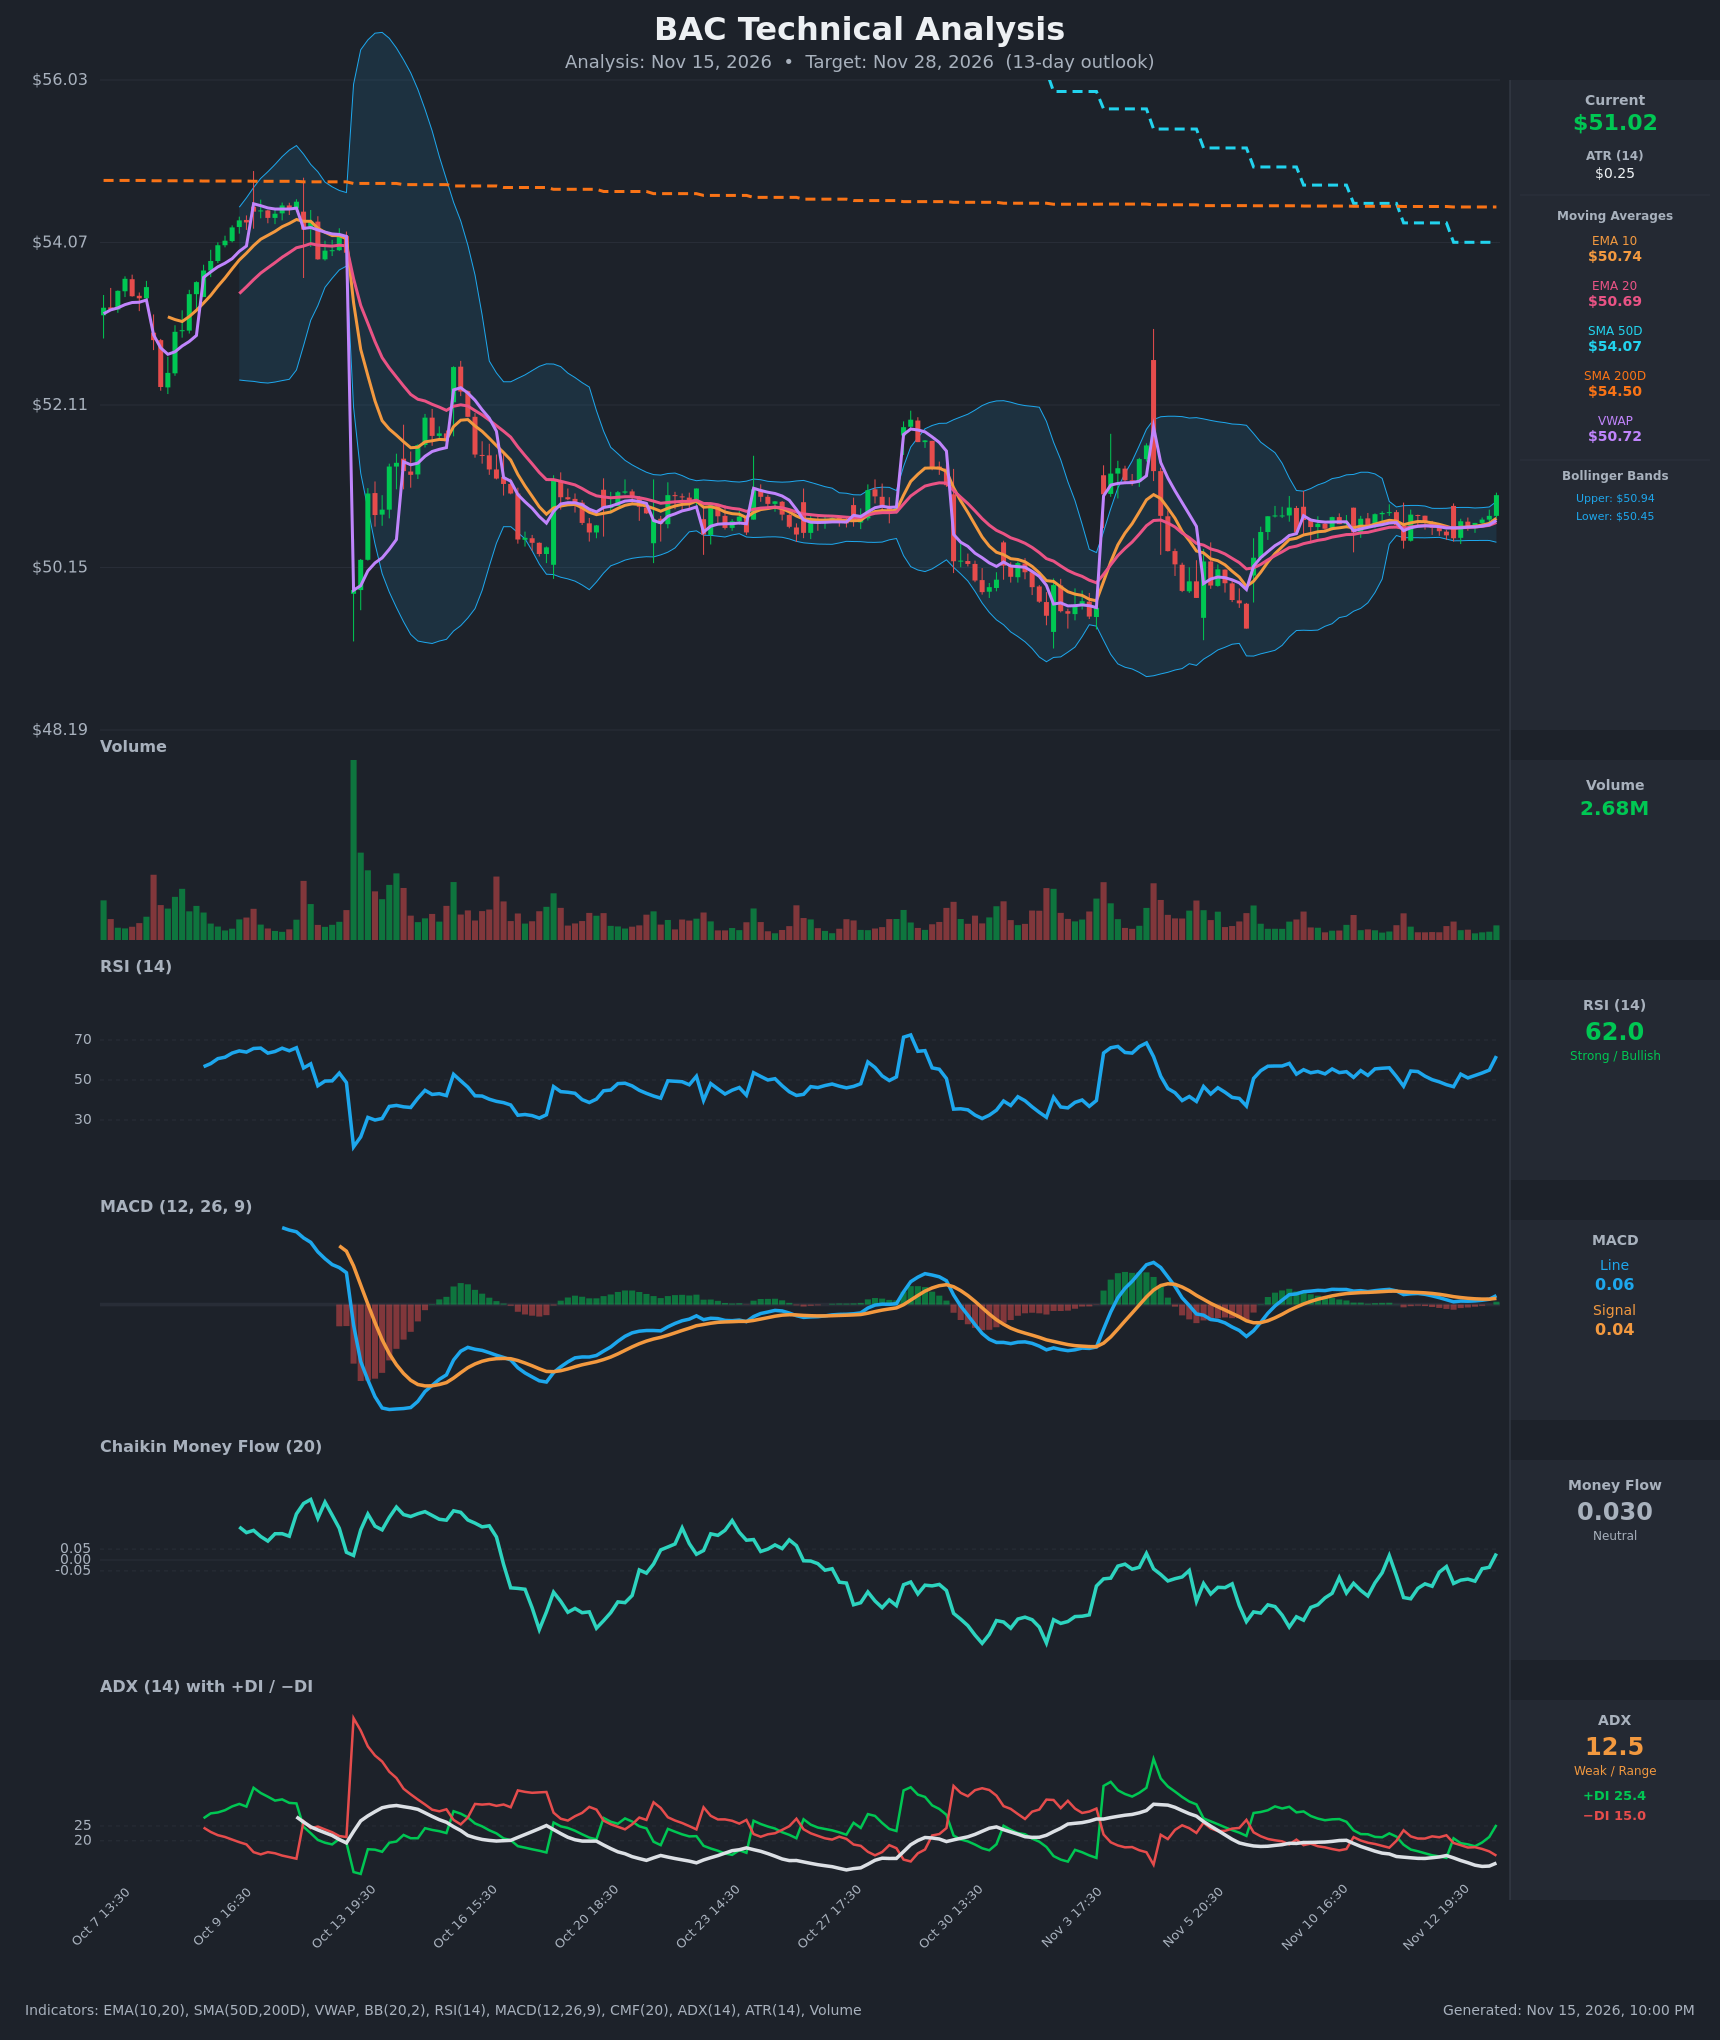
- RSI (14): 61.96, up sharply from about 47 on Nov 12 and 55 an hour earlier. It is in the strong-momentum zone but not yet overbought (<70). It is climbing out of a 45-55 range that held for about 10 days. [Bullish]
- 20 EMA: $50.69, with the 10 EMA at $50.74. Price at $51.02 is above both, and EMA10 is above EMA20 and rising after weeks of flat, intertwined averages. The EMAs are acting as support. [Bullish]
- MACD: Line 0.061 is above Signal 0.042, and the histogram is positive and expanding. It crossed up on the last bar after the line sat below the signal from Nov 12 to Nov 13. The readings are near zero, so this is an early, low-amplitude turn. [Bullish]
- Bollinger Bands (20): Upper $50.94, lower $50.45, which is a very narrow squeeze of about $0.49 (roughly 1% of price). Price at $51.02 closed above the upper band, an upside breakout from a volatility compression. A single close outside the band in a squeeze is more often an expansion trigger than an exhaustion signal, but it can mean-revert if it fails to hold. [Bullish]
- CMF (20): 0.030, which is neutral (between -0.05 and +0.05). It was negative for most of the past two weeks (-0.17 on Nov 12) and has just crossed above zero. Accumulation is emerging but not confirmed. [Neutral]
- ADX (14): 12.5, a weak, range-bound trend, but it ticked up from 11.3. +DI at 25.4 is above −DI at 15.0, a fresh bullish DI crossover and a widening spread. Direction favors bulls, but there is no trend strength yet. [Weak Trend, bullish lean]
- Volume: 2.68M on the breakout bar, which is average to below average. It is far below the spike on the mid-October selloff. The breakout lacks volume confirmation, so follow-through is not guaranteed. [Neutral / mildly unconfirmed]
Other context:
- VWAP: $50.72, and price is above it, which signals buying pressure.
- SMA 50D / 200D: $54.07 and $54.50. Price is about 5-6% below both, so the long-term trend is still down. SMA50 is below SMA200 (a death-cross configuration), though the gap is narrowing. These are overhead resistance and cap the upside.
DIVERGENCES & TRENDS
- No major price/indicator divergence. Price, RSI, MACD and DI are all turning up together.
- Momentum shift: RSI jumped from 55 to 62 on the last bar, MACD crossed above its signal, and +DI crossed back above −DI (it was below from Nov 11 to Nov 12). Together these are an early bullish turn.
- CMF: it improved from -0.17 to +0.03 while price stayed in a tight range, a mild bullish divergence in which money flow recovered before the breakout.
- Long-term trend: price remains below the declining SMA50 and SMA200 and well below the mid-October highs near $54. The bounce is a counter-trend move within a larger downtrend.
- Range: price has traded roughly between $49.80 and $51.80 since the Oct 13 gap down, and ADX has been under 20 the whole time.
CHART PATTERNS
- Closest match: a Bollinger squeeze and tight flat consolidation resembling an Ascending Triangle / flat base. Lows are rising from the Nov 6-7 trough near $49.9 to about $50.4, with a flat ceiling near $51. The breakout above that ceiling is the bullish resolution.
- Reversal context: the Oct-Nov series of lows near $49.9-$50.1 is loosely a Bullish Double Bottom. Its neckline would be the $51.5-$52 area, and a measured move implies about $52.5-$53.
- Caveat: this is not a textbook pattern. The breakout has not cleared the $51.50-$52.10 resistance zone, and volume is unremarkable.
POTENTIAL SCENARIOS
- Scenario 1: Bullish Squeeze Breakout Follow-Through — The Bollinger squeeze resolves upward, with price holding above the upper band and EMAs, and RSI pushing toward 65-70. Trigger: hold above $50.95 and a close above $51.50. Target: $52.10 first, then $52.80-$53.20 (the double-bottom measured move). Invalidation: close back below $50.69 (EMA20). (50% probability)
- Scenario 2: Neutral Range Retest — The breakout stalls on light volume and price drifts back into the $50.40-$51.50 range as ADX stays below 20. Trigger: failure to close above $51.50 and RSI rolling back to 50-55. Target: $50.60-$51.20. Invalidation: a decisive close above $51.80 or below $50.30. (30% probability)
- Scenario 3: Bearish Failed Breakout — The band breakout is a false move, and sellers push price back below the EMAs, targeting the lower range. Trigger: close below $50.45 (lower band) with MACD crossing back down. Target: $49.80-$50.10, and possibly $49.40 if the range low fails. Invalidation: reclaim of $51.20 on rising volume. (20% probability)
PRICE TARGETS
- Target Price: $51.65 (13-day outlook, Nov 28, 2026)
- Expected Range: $49.50 to $53.70. Width is $4.20, or about 8.2% of the $51.02 current price, consistent with the 7-10 to 14-21 day guidance for a 13-day horizon.
- Key Levels: Support at $50.69 (EMA20, with the $50.45 lower band beneath), Resistance at $52.10
OVERALL BIAS
OVERALL BIAS: BULLISH - Price has broken above a tight Bollinger squeeze with a fresh MACD bullish crossover, +DI over −DI, RSI rising to 62 and CMF turning positive. Upside is limited by the weak ADX, unremarkable volume and the declining SMA50/SMA200 overhead at $54+, so conviction is modest.
This is educational analysis and not financial advice.