KWEB 13-day bearish forecast — Nov 15, 2026
- Bias: Bearish
- Timeframe: 13 days (made Nov 15, 2026, target date Nov 27, 2026)
- Price at analysis: $22.93
- Price target: $22.60
- Expected range: $21.70 – $23.70
- Result: Pending — graded after the close on Nov 27, 2026
Get a free AI analysis of KWEB today
Analysis
TECHNICAL INDICATORS
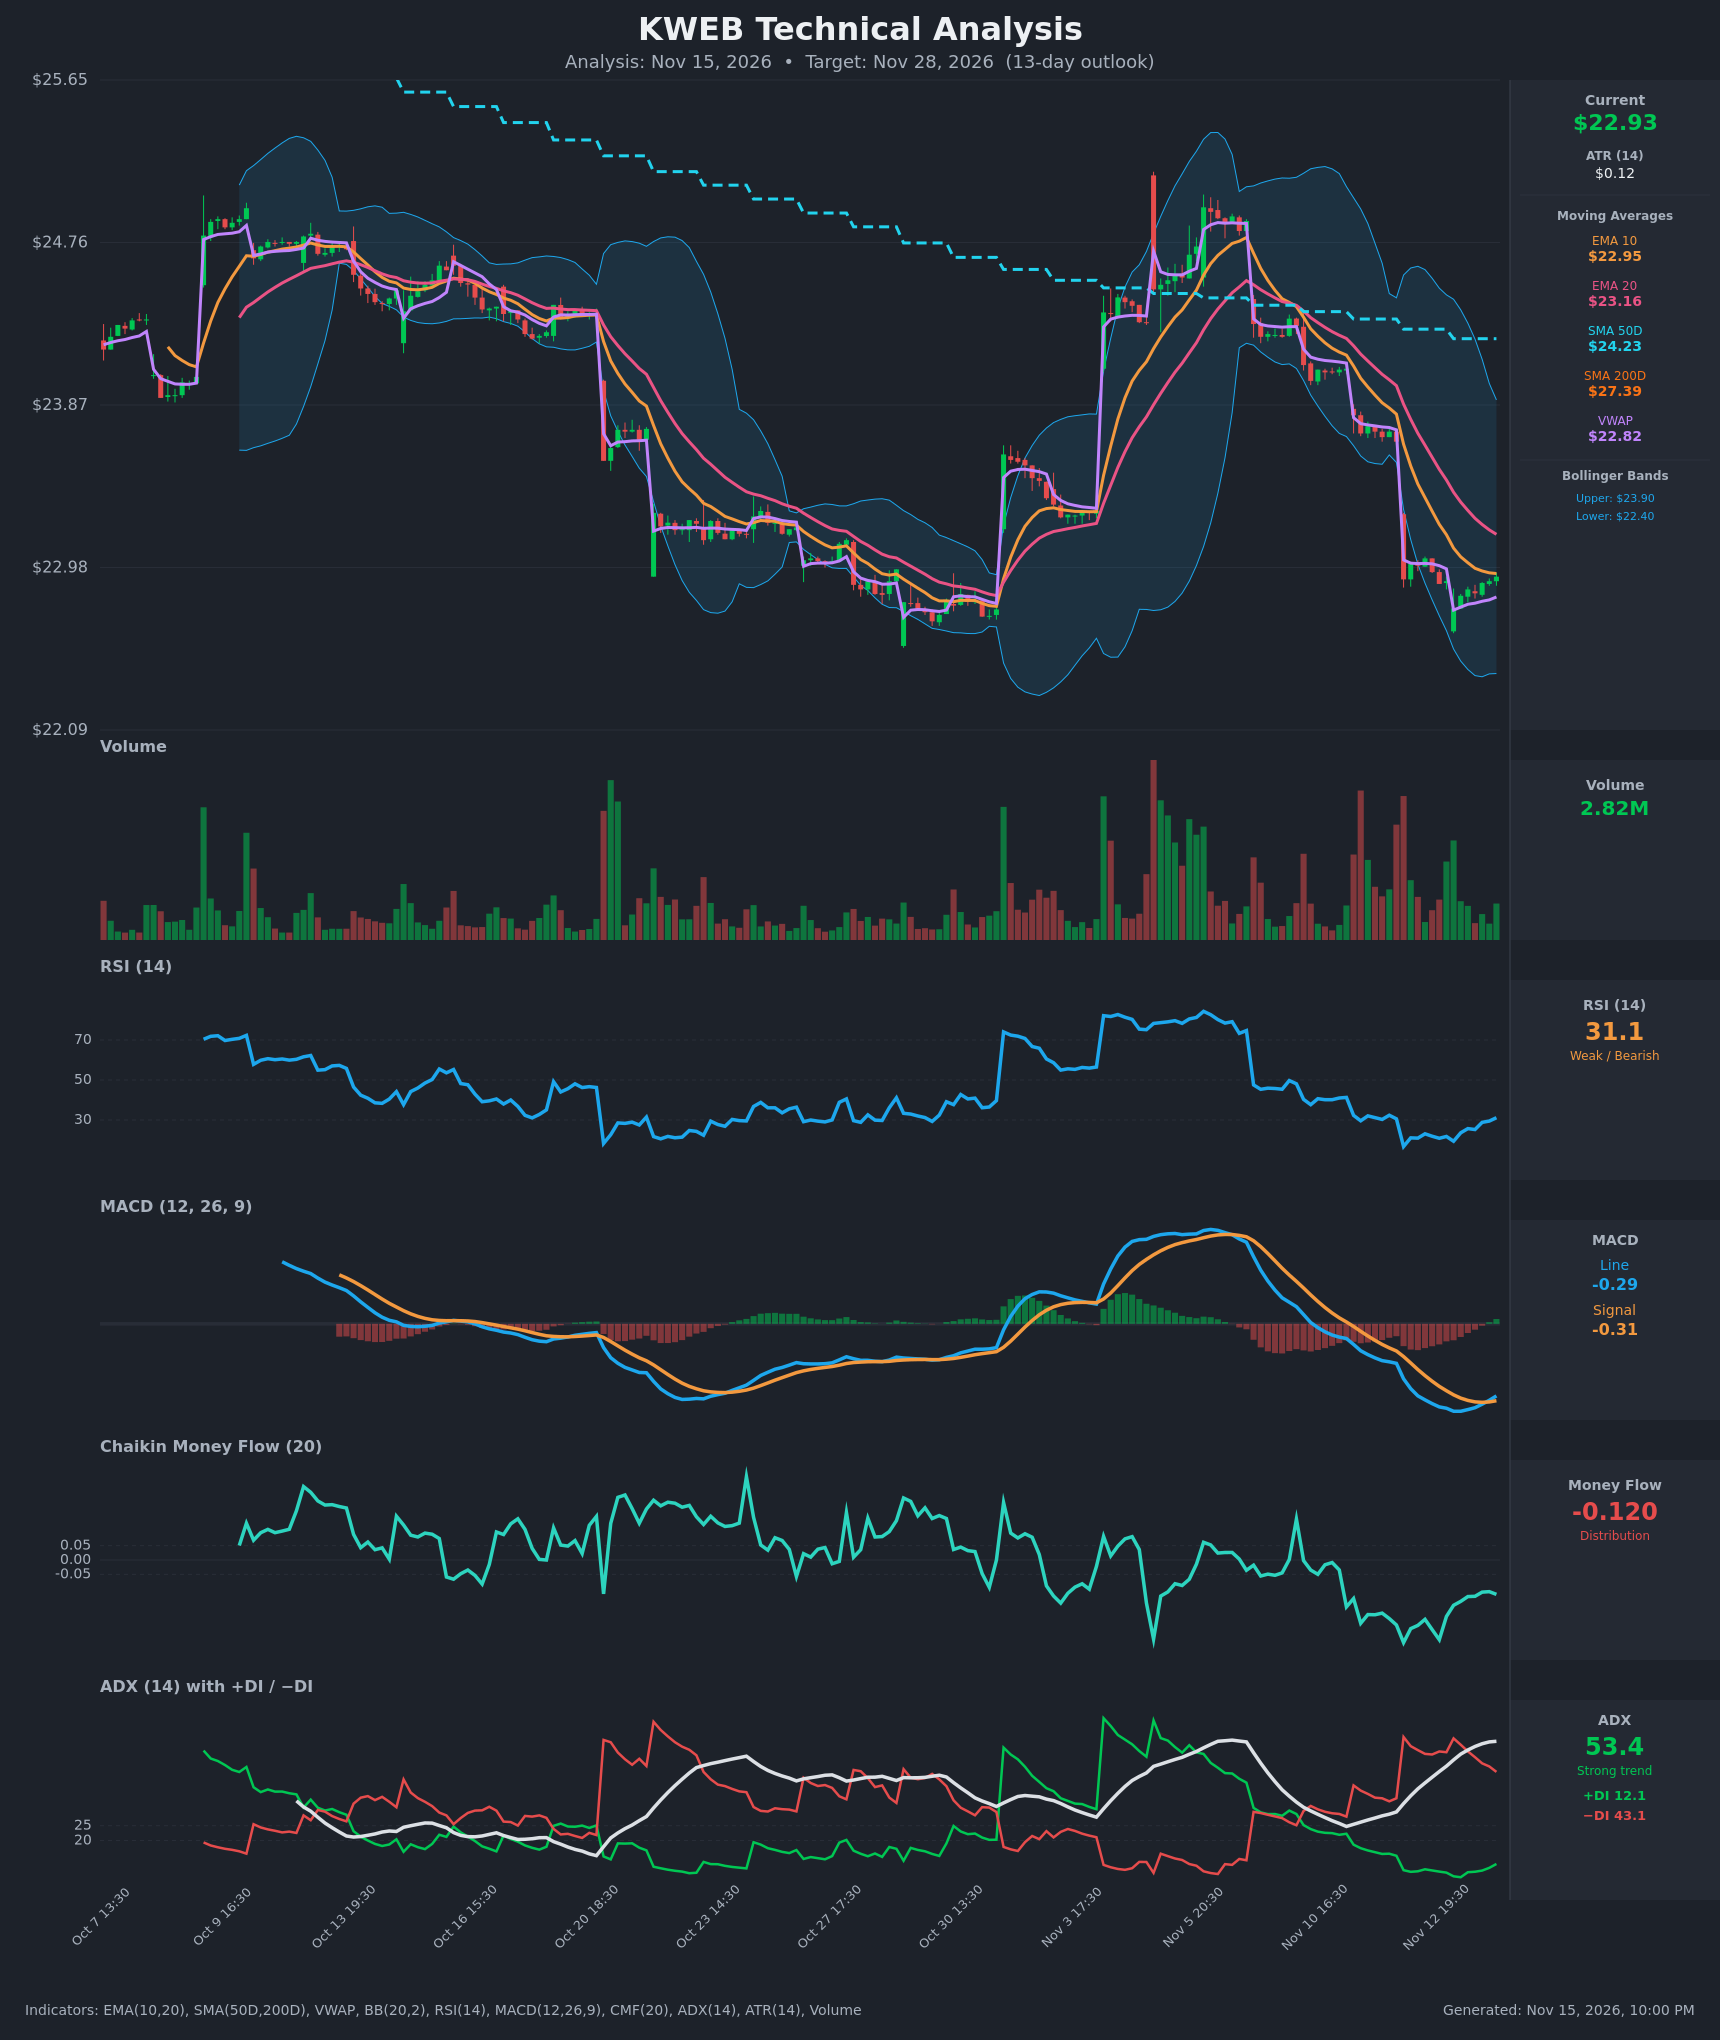
- RSI (14): 31.15, rising from an extreme low of 16.7 on Nov 12 and now just above the 30 line. This is a bounce from deeply oversold, but it is still below 50, so momentum is weak. [Bearish]
- 20 EMA: $23.16, with price ($22.93) below it. EMA10 ($22.95) is also below EMA20, so the bearish EMA stack persists. The EMA20 is overhead resistance, and price is only just reaching the EMA10. [Bearish]
- MACD: Line -0.295 vs signal -0.3145, with a slightly positive histogram. A fresh bullish crossover has just occurred, but it is deep below zero, which makes it a relief signal rather than a trend change. [Neutral]
- Bollinger Bands (20): Upper $23.90, lower $22.40, with price in the lower half and near the lower-middle zone. The bands are wide after the volatile move, and the midline (~$23.15) is overhead. Price has bounced off the lower band without breaking out. [Bearish]
- CMF (20): -0.120, below -0.05, with sustained negative readings. That means distribution, though it has improved slightly from -0.29. [Distribution]
- ADX (14): 53.4, very strong and rising, with +DI 12.1 far below -DI 43.1. Bears are firmly in control. The very high ADX also warns the move is mature and prone to relief bounces. [Strong Trend – Bearish]
- Volume: 2.82M, average and unremarkable on the latest bounce bars. The heavy volume came on the red sell-off candles, and the recovery is on lighter volume. That is a weak bounce. [Bearish-leaning]
Other levels:
- VWAP: $22.82, just below price, a slight short-term support.
- SMA50D: $24.23.
- SMA200D: $27.39. Price is well below both, and SMA50 is far below SMA200, a death-cross structure.
DIVERGENCES & TRENDS
- Positive momentum divergence (minor): RSI made a much lower low (16.7) while price only drifted flat around $22.75–23.03. MACD is also turning up and has crossed its signal line. This suggests selling is exhausting short term.
- Trend: The long-term trend is clearly down. Price is below the EMA10, EMA20, SMA50 and SMA200, and the gap to the SMA200 is large.
- Crossovers: The MACD bullish crossover is just forming. The -DI is falling from 54.8 to 43.1 and +DI is edging up, so the bearish directional pressure is easing, but there is no DI crossover.
- CMF: It remains below zero, so there is no accumulation yet to back the bounce.
- Price structure: A tight sideways grind (~$22.75–$23.03) followed the sharp drop from ~$23.7 on Nov 12. This looks like a pause in the downtrend rather than a reversal.
CHART PATTERNS
- Bearish Flag / Pennant (continuation): The sharp drop on Nov 12 was followed by a tight, low-volume consolidation, which matches a bearish pennant or flag. A break below ~$22.75 projects a measured move of roughly $1.0–1.2 (flagpole ≈ $1.0–1.5), pointing toward ~$21.8–22.0.
- Larger context: The month-long series of lower highs ($24.8 → $24.0) matches a descending channel / bearish continuation. No reversal pattern (double bottom, inverted H&S) has yet been confirmed.
- Invalidation of the bearish patterns: A close above the EMA20 / ~$23.20 would weaken the flag and open a relief move toward the Bollinger midline and the $23.5–23.9 area.
POTENTIAL SCENARIOS
- Scenario 1: Bearish Flag Breakdown / Trend Continuation — The tight consolidation resolves lower in line with the strong ADX and -DI dominance, with distribution (CMF) continuing. Trigger: a close below ~$22.75 and the VWAP ($22.82) on rising volume. Target: $22.40 (lower band), then $22.00–21.90. Invalidation: a sustained close above $23.20 (EMA20). (50% probability)
- Scenario 2: Bullish Oversold Relief Bounce — The RSI recovery and MACD cross fuel a mean-reversion bounce back toward the moving averages. Trigger: a break above $23.16 (EMA20) with improving CMF. Target: $23.50–$23.90 (Bollinger midline/upper band). Invalidation: a failure at the EMA20 and a close below $22.75. (33% probability)
- Scenario 3: Neutral Base-Building Range — Price chops between $22.60 and $23.20 as selling exhausts and buyers fail to take control. Trigger: low-volume, narrowing candles. Target: ~$22.90. Invalidation: a close beyond either range boundary. (17% probability)
PRICE TARGETS
- Target Price: $22.60 (13-day)
- Expected Range: $21.70 to $23.70 (width $2.00 ≈ 8.7% of the current price, in line with the guidance for a ~13-day horizon)
- Key Levels: Support at $22.40, Resistance at $23.16
OVERALL BIAS
OVERALL BIAS: BEARISH - Price is below every major moving average, ADX is above 50 with -DI far above +DI, and CMF shows persistent distribution. The tight post-drop consolidation looks like a bearish flag, so the oversold RSI and fresh MACD cross most likely give only a limited relief bounce that fails near the $23.16 EMA20.
This is educational analysis and not financial advice.