IWM 13-day bearish forecast — Nov 15, 2026
- Bias: Bearish
- Timeframe: 13 days (made Nov 15, 2026, target date Nov 27, 2026)
- Price at analysis: $277.55
- Price target: $274.50
- Expected range: $266.50 – $287.00
- Result: Pending — graded after the close on Nov 27, 2026
Get a free AI analysis of IWM today
Analysis
TECHNICAL INDICATORS
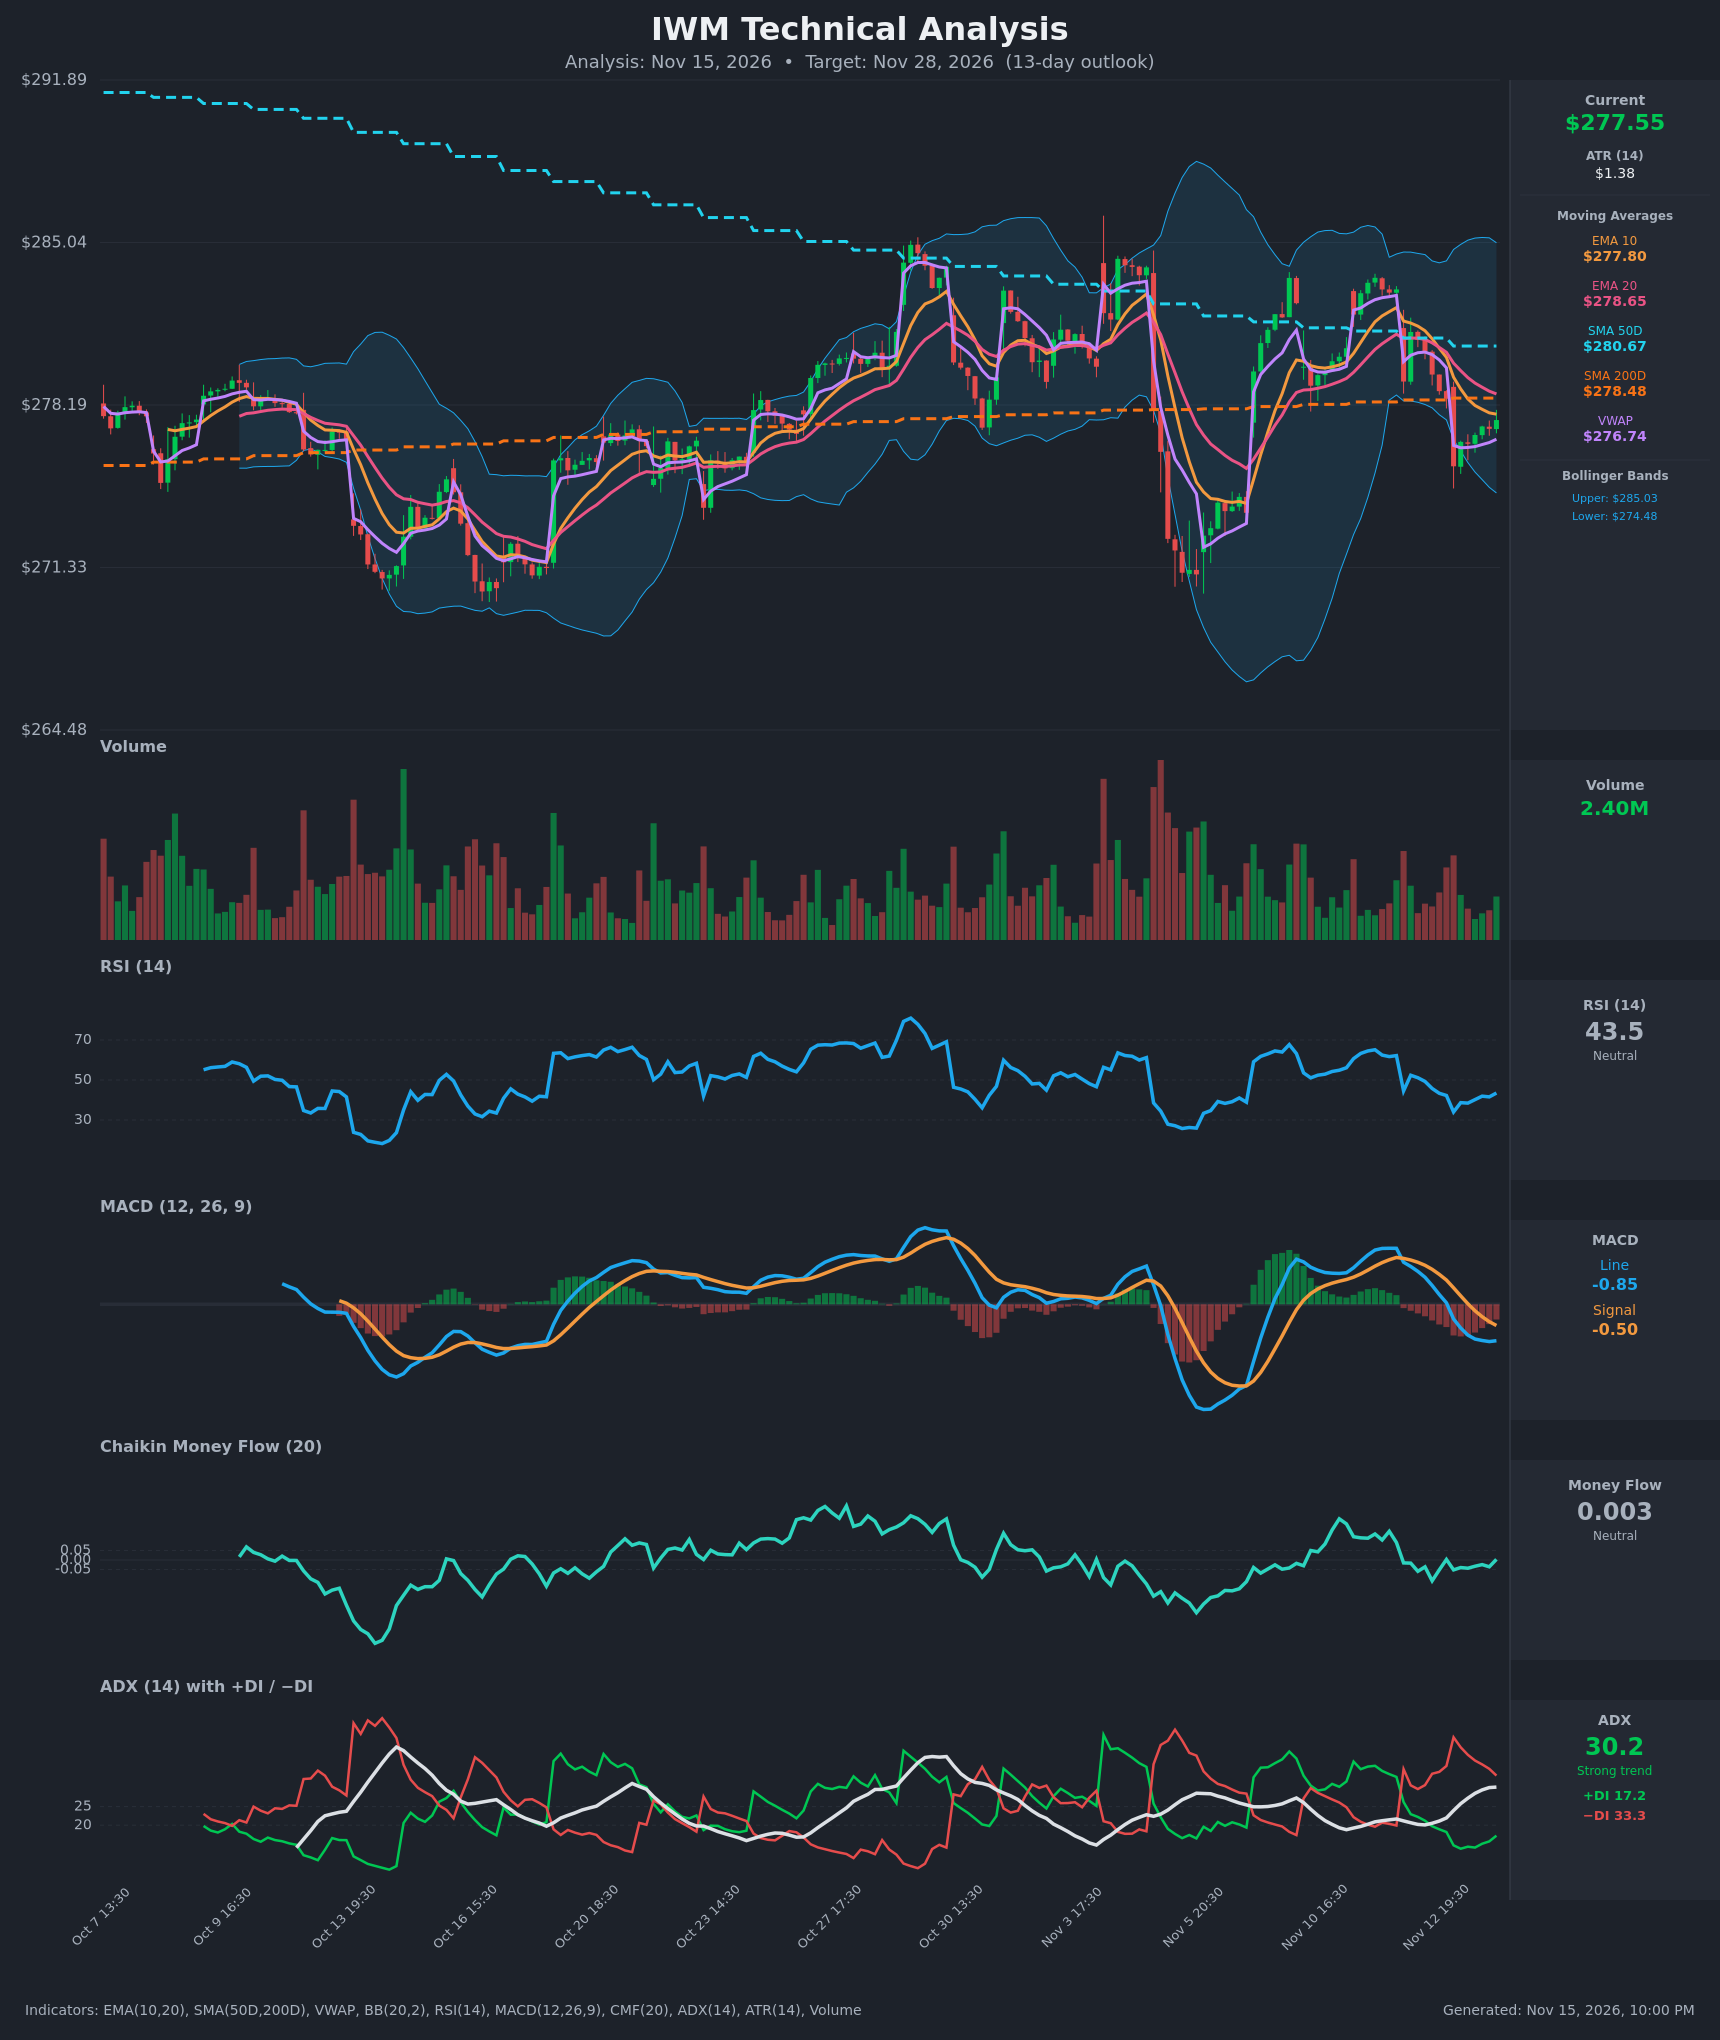
- RSI (14): 43.49, recovering from a 34.0 low on Nov 13 but still below the 50 midline. Momentum is bearish-leaning with a modest bounce. It is not oversold, so there is room to fall further. [Bearish]
- 20 EMA: $278.65, with price at $277.55 below it. EMA10 ($277.80) is also above price, and EMA10 is below EMA20 after the bearish cross around Nov 12. The EMAs are sloping down and act as overhead resistance. [Bearish]
- MACD: Line -0.854 is below Signal -0.497, and the histogram is negative at about -0.36. The bearish crossover occurred Nov 13 and the line is below zero. The line has flattened over the last few bars (-0.81, -0.85, -0.87, -0.85), so downside momentum is stabilizing but not reversing. [Bearish]
- Bollinger Bands (20): Upper $285.03, lower $274.48, middle about $279.75. Price sits in the lower half, about $3 above the lower band. The bands are relatively wide, so volatility is moderate. There is no squeeze, and a walk toward the lower band is plausible. [Bearish]
- CMF (20): 0.003, inside the ±0.05 neutral zone. It has faded from clearly positive readings in the Nov 10-11 area, so buying pressure has dissipated but heavy distribution is not confirmed. [Neutral]
- ADX (14): 30.2 and rising from about 20 on Nov 12. −DI (33.3) is far above +DI (17.2), a wide spread. This shows a strong downtrend with bears firmly in control. [Strong Trend - Bearish]
- Volume: 2.40M, below the heavy-volume selling spikes seen around Nov 5. The recent bounce is on light volume, which suggests weak buying conviction. [Neutral-to-Bearish]
Other levels:
- SMA50D is $280.67 and SMA200D is $278.48. Price is below both, so the long-term bias is slightly negative.
- Price is above VWAP ($276.74), a minor intraday support.
- There is no golden or death cross; SMA50D remains above SMA200D.
DIVERGENCES & TRENDS
- No clear divergence. RSI made a higher low (about 34 vs. the 27-28 trough earlier in November) while price is also near prior lows. That is a mild improvement but not a true bullish divergence.
- Trend: The indicators have turned down since Nov 11. EMA10 crossed below EMA20, MACD crossed below Signal and then below zero, and −DI crossed above +DI on Nov 12 with ADX rising through 25.
- Breaks: Price lost the SMA50D ($280.67) and the SMA200D ($278.48) and has not recovered either.
- Bounce: The last few bars show a mild bounce off $275.60, with RSI up from 34 to 43.5. It is capped under the EMAs, and the Nov 13 gap-down session left the rally unconfirmed.
CHART PATTERNS
- Bearish Double Top (developing, unconfirmed): Highs near $285 (Oct 28) and about $284 (Nov 10-11) are separated by a trough near $272 (Nov 5). A neckline break below roughly $272 would project a measured move toward about $259. That is well beyond this 13-day window.
- Range context: Price has traded in a roughly $271-$285 band for over a month. The recent lower high and the pullback to the lower half of the range tilt the structure bearish.
- Short-term: The bounce from $275.60 resembles a small bear-flag/rising-pullback inside a downtrend. Resolution lower toward the $272-$274 area is the base case.
POTENTIAL SCENARIOS
- Scenario 1: Bearish Trend Continuation — Strong ADX with −DI dominance and a negative MACD point to a retest of the lower Bollinger Band and the early-November lows. Trigger: rejection at the EMA20/SMA200 zone ($278.50-$278.65) and a break below $275.60. Target: $272-$274.50. Invalidation: a daily close above $280.70 (SMA50D). (50% probability)
- Scenario 2: Neutral Range Chop — The market stays inside the long-standing range, and the oversold bounce stalls near the EMA cluster. Trigger: volume dries up and ADX rolls over. Target: $274.50-$279.00. Invalidation: a break of either $272.00 or $280.70. (25% probability)
- Scenario 3: Bullish Mean-Reversion Rally — A rebound back toward the Bollinger midline and the upper range. Trigger: reclaiming $278.65 with MACD histogram turning up and CMF above +0.05. Target: $281-$284. Invalidation: a failure back below $276.00. (25% probability)
PRICE TARGETS
- Target Price: $274.50 (13-day)
- Expected Range: $266.50 to $287.00 (width $20.50, about 7.4% of the current price, consistent with a 13-day horizon)
- Key Levels: Support at $272.00, Resistance at $278.65
OVERALL BIAS
OVERALL BIAS: BEARISH - ADX at 30 and rising with −DI (33.3) far above +DI (17.2), a bearish MACD crossover below zero, and price below the 10/20 EMAs and SMA50D point to further downside. The bounce is on light volume and neutral CMF, so a retest of the $272-$274.50 area is more likely than a recovery above $280.70.
This is educational analysis and not financial advice.