QQQ 13-day bullish forecast — Nov 15, 2026
- Bias: Bullish
- Timeframe: 13 days (made Nov 15, 2026, target date Nov 27, 2026)
- Price at analysis: $679.90
- Price target: $687.00
- Expected range: $652.00 – $710.00
- Result: Pending — graded after the close on Nov 27, 2026
Get a free AI analysis of QQQ today
Analysis
TECHNICAL INDICATORS
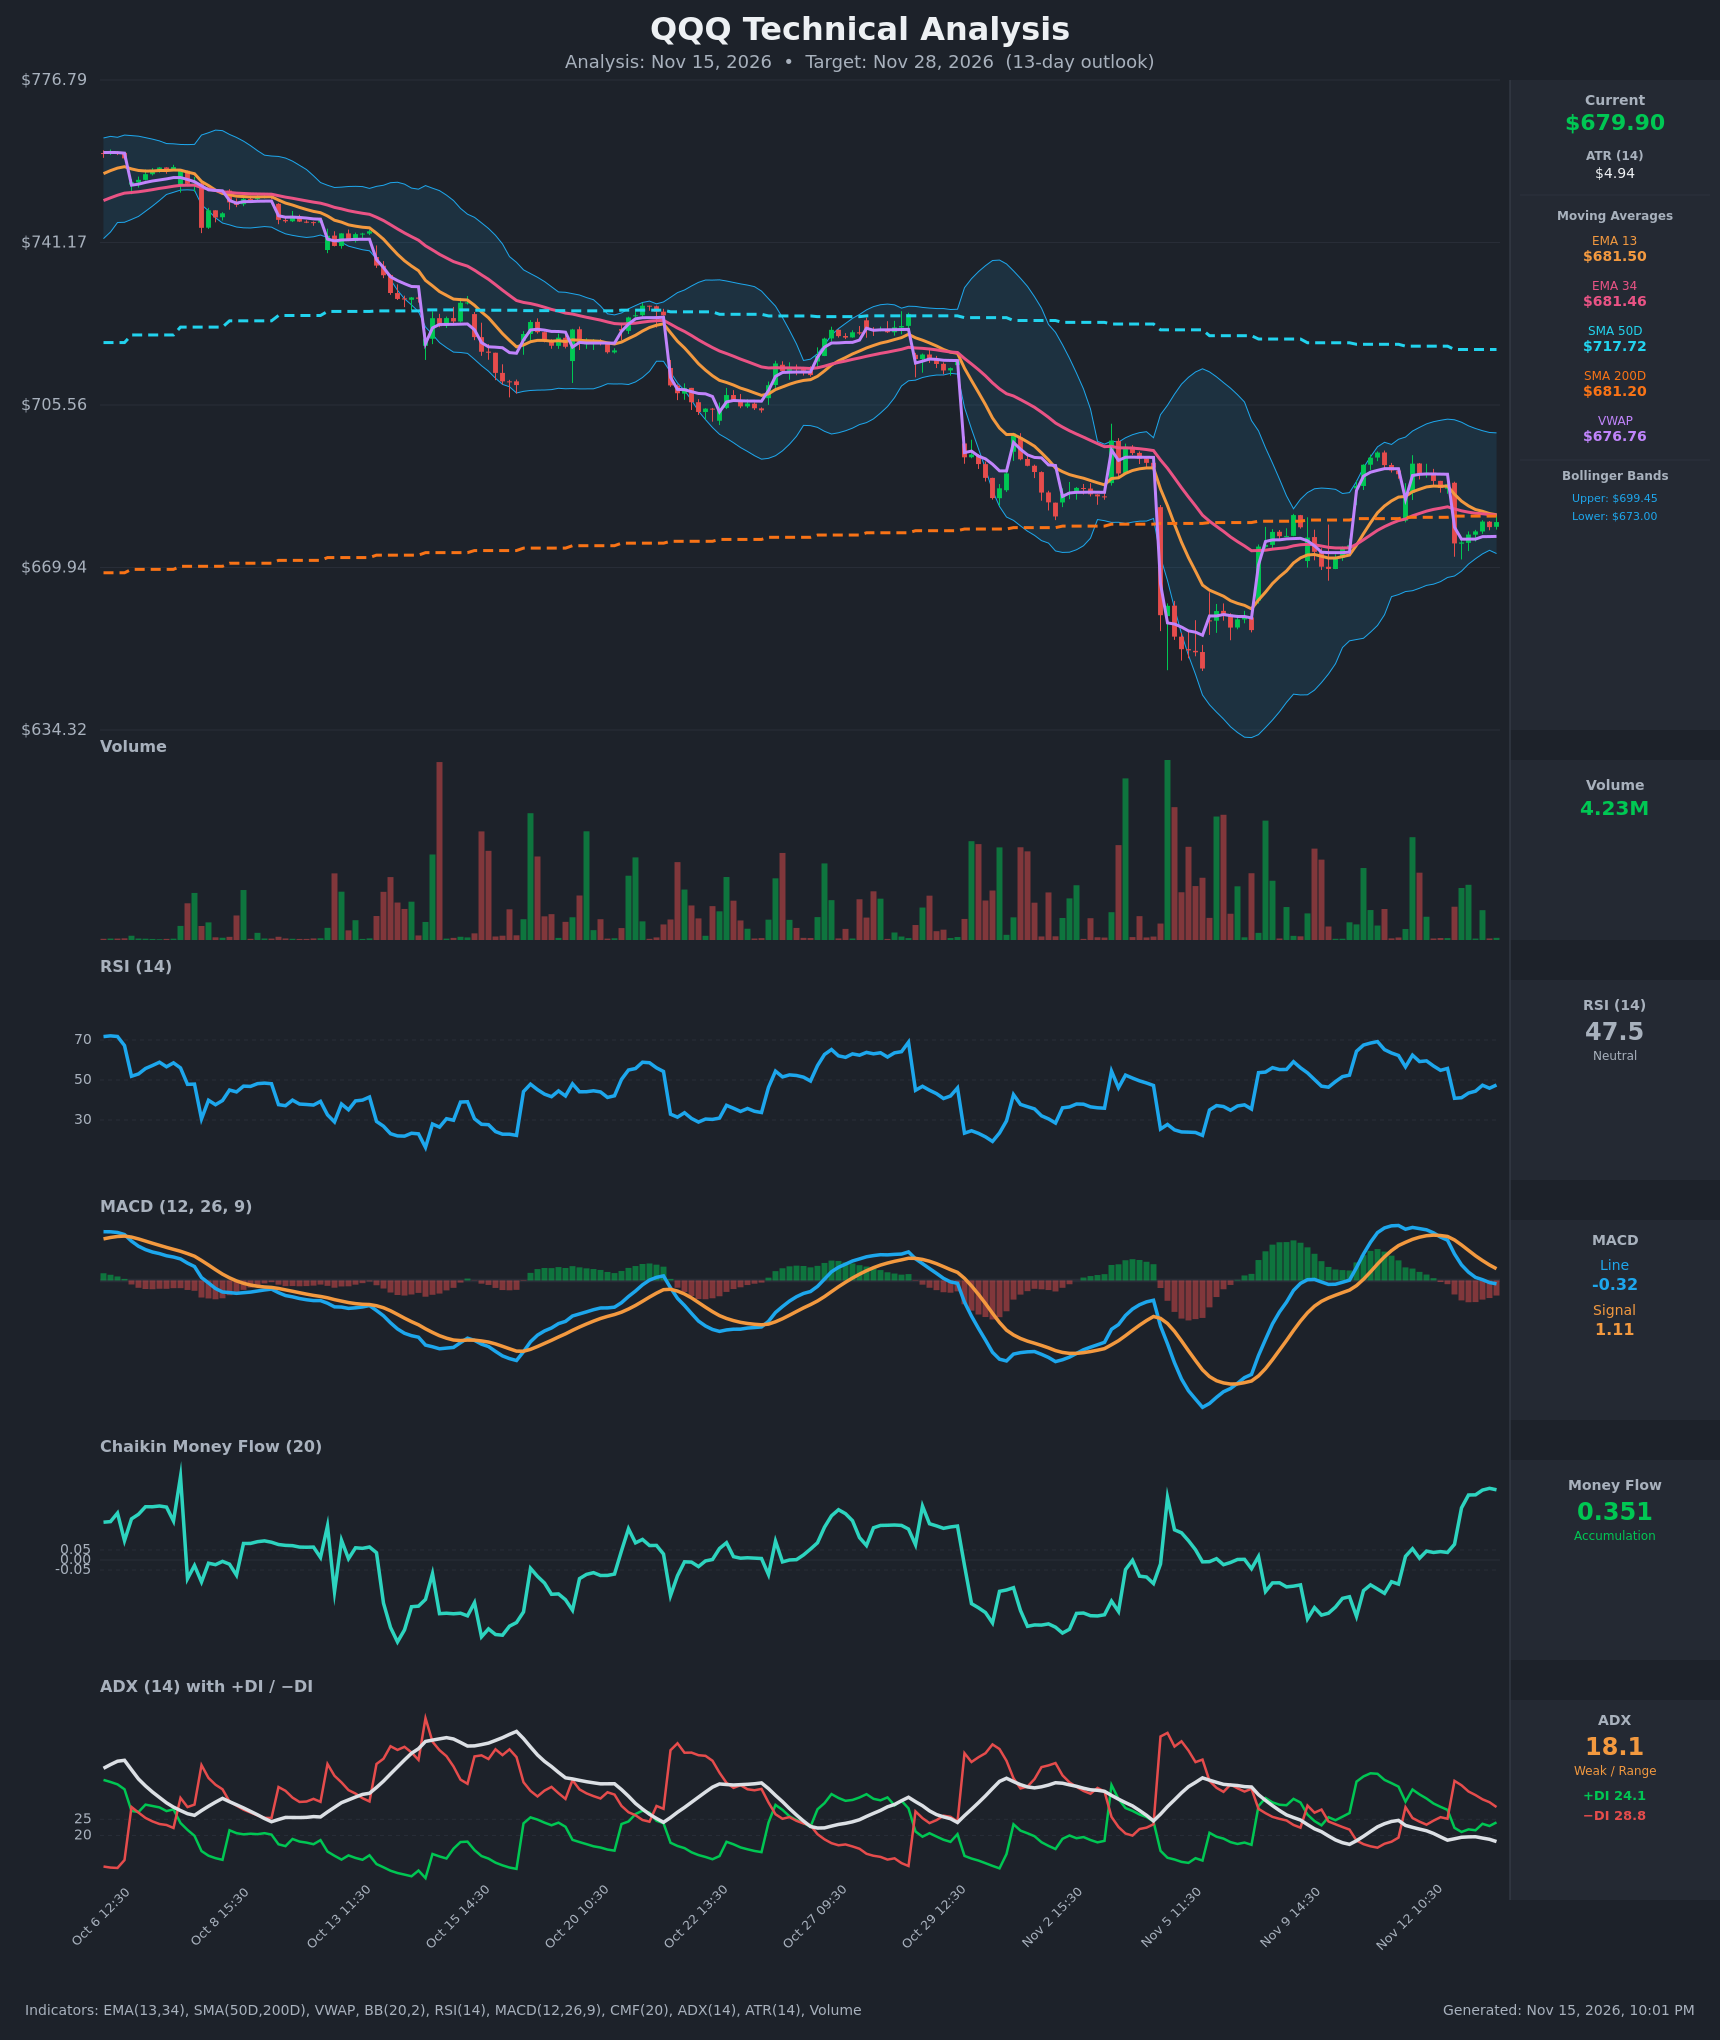
- RSI (14): 47.51, just under the 50 midline. It fell from 62 on Nov 11-12 to a low of ~41 on Nov 13, then recovered to the high 40s. It is neutral, with momentum stabilizing after the drop. [Neutral]
- 20 EMA (EMA 13/34 used): EMA13 is $681.50 and EMA34 is $681.46, essentially flat and converged. Price at $679.90 sits just under both, so they act as nearby resistance. EMA13 recently crossed below its earlier lead over EMA34, which shows fading short-term momentum. [Bearish]
- MACD: The line is -0.32 and the signal is 1.11. The line crossed below the signal on Nov 13, and the histogram is negative and still expanding. The line is only just below zero, so the bearish momentum is not deep. [Bearish]
- Bollinger Bands (20): Upper $699.45, lower $673.00, midline ~$686.2. Price is in the lower half of the bands, about 26% of the band width above the lower band. The bands have narrowed sharply from the early-November expansion, which points to a volatility squeeze and a pending directional move. [Neutral]
- CMF (20): 0.351, well above +0.05 and rising for several sessions. This is strong accumulation, with buyers absorbing the Nov 13 gap-down while price held. [Accumulation]
- ADX (14): 18.1 and falling, below 20, so the market is weak or range-bound. −DI (28.8) is above +DI (24.1), so bears have a mild edge, but the gap is narrowing. [Weak Trend, mild bearish lean]
- Volume: 4.23M, modest and below the spikes seen on the early-November selloff and rebound. The Nov 13 decline did not see an expansion of selling volume. [Neutral to mildly supportive of stabilization]
Other levels:
- Price is above VWAP ($676.76), a small positive.
- Price is right at SMA200 ($681.20), which is acting as a pivot.
- Price is well below SMA50D ($717.72), which is still sloping down and keeps the intermediate trend bearish.
DIVERGENCES & TRENDS
- Bullish CMF divergence: CMF has risen from about -0.1 to +0.35 while price made lower intraday closes (Nov 13 gap to $675). Money flow is improving while price is flat, a classic accumulation signal.
- Bearish momentum cross: MACD crossed below its signal and EMA13 lost its premium over EMA34. DI also flipped to −DI dominance on Nov 13. These are short-term negatives.
- Higher low: The Nov 5-6 low near $655 was followed by a higher low around $675. This is a modest base but not yet a confirmed uptrend.
- Larger trend: The decline from ~$760 in early October is still intact, with lower highs and price below SMA50D. ADX at 18.1 shows the selling pressure has faded.
- Moving-average cluster: EMA13, EMA34 and SMA200 are all stacked at $681-681.5 right above price. A close back above this cluster would be a bullish shift.
CHART PATTERNS
- Reversal base / consolidation: After the early-November flush to ~$655 and the sharp rebound, price has formed a range of roughly $673-$692. This loosely resembles the Bullish Falling Wedge / Expanding Triangle reversal setups, but it is not fully confirmed.
- Competing read: A Bearish Flag/Pennant reading is possible after the Nov 13 drop, with a breakdown below $673 targeting a retest of $655-660.
- Significance and targets: A bullish breakout above $692-$699 (the upper band) projects toward $705-$710, where the earlier high-volume breakdown zone sits. A breakdown below $673 projects toward $655.
POTENTIAL SCENARIOS
- Scenario 1: Bullish Accumulation Recovery — CMF accumulation and the SMA200 pivot support a push back above the EMA cluster and toward the Bollinger midline and upper band. Trigger: hourly close above $682 (EMA13/34 and SMA200), then above $688. Target: $688-$699, with an extension to ~$705. Invalidation: close below $673 (lower band). (45% probability)
- Scenario 2: Bearish Rejection and Breakdown — Price fails at the $681-682 resistance cluster, MACD and −DI weakness persists, and the downtrend below SMA50D resumes. Trigger: rejection at $682 followed by a break under $673. Target: $660, then $655. Invalidation: close above $692. (35% probability)
- Scenario 3: Neutral Range Chop — With ADX below 20 and the bands squeezing, price oscillates between ~$673 and ~$692 without a decisive breakout. Trigger: failure to break either band. Target: $678-$688. Invalidation: close outside the $670-$695 range. (20% probability)
PRICE TARGETS
For the 13-day timeframe (target date Nov 28, 2026):
- Target Price: $687.00
- Expected Range: $652.00 to $710.00 (width $58, about 8.5% of current price, consistent with 14-21 day guidance scaled slightly down for 13 days)
- Key Levels: Support at $673.00 (lower Bollinger Band), Resistance at $692.70 (Nov 12 high close, just below the upper band at $699.45)
OVERALL BIAS
OVERALL BIAS: BULLISH - Strong CMF accumulation (0.351), price above VWAP, a higher low since early November, and a squeeze with price sitting on the SMA200 pivot outweigh the bearish MACD cross and −DI lead. Conviction is modest because ADX is weak and price is still below the downward-sloping SMA50D.
This is educational analysis and not financial advice.