SMCI 13-day bearish forecast — Nov 15, 2026
- Bias: Bearish
- Timeframe: 13 days (made Nov 15, 2026, target date Nov 27, 2026)
- Price at analysis: $26.87
- Price target: $26.00
- Expected range: $24.75 – $27.35
- Result: Pending — graded after the close on Nov 27, 2026
Get a free AI analysis of SMCI today
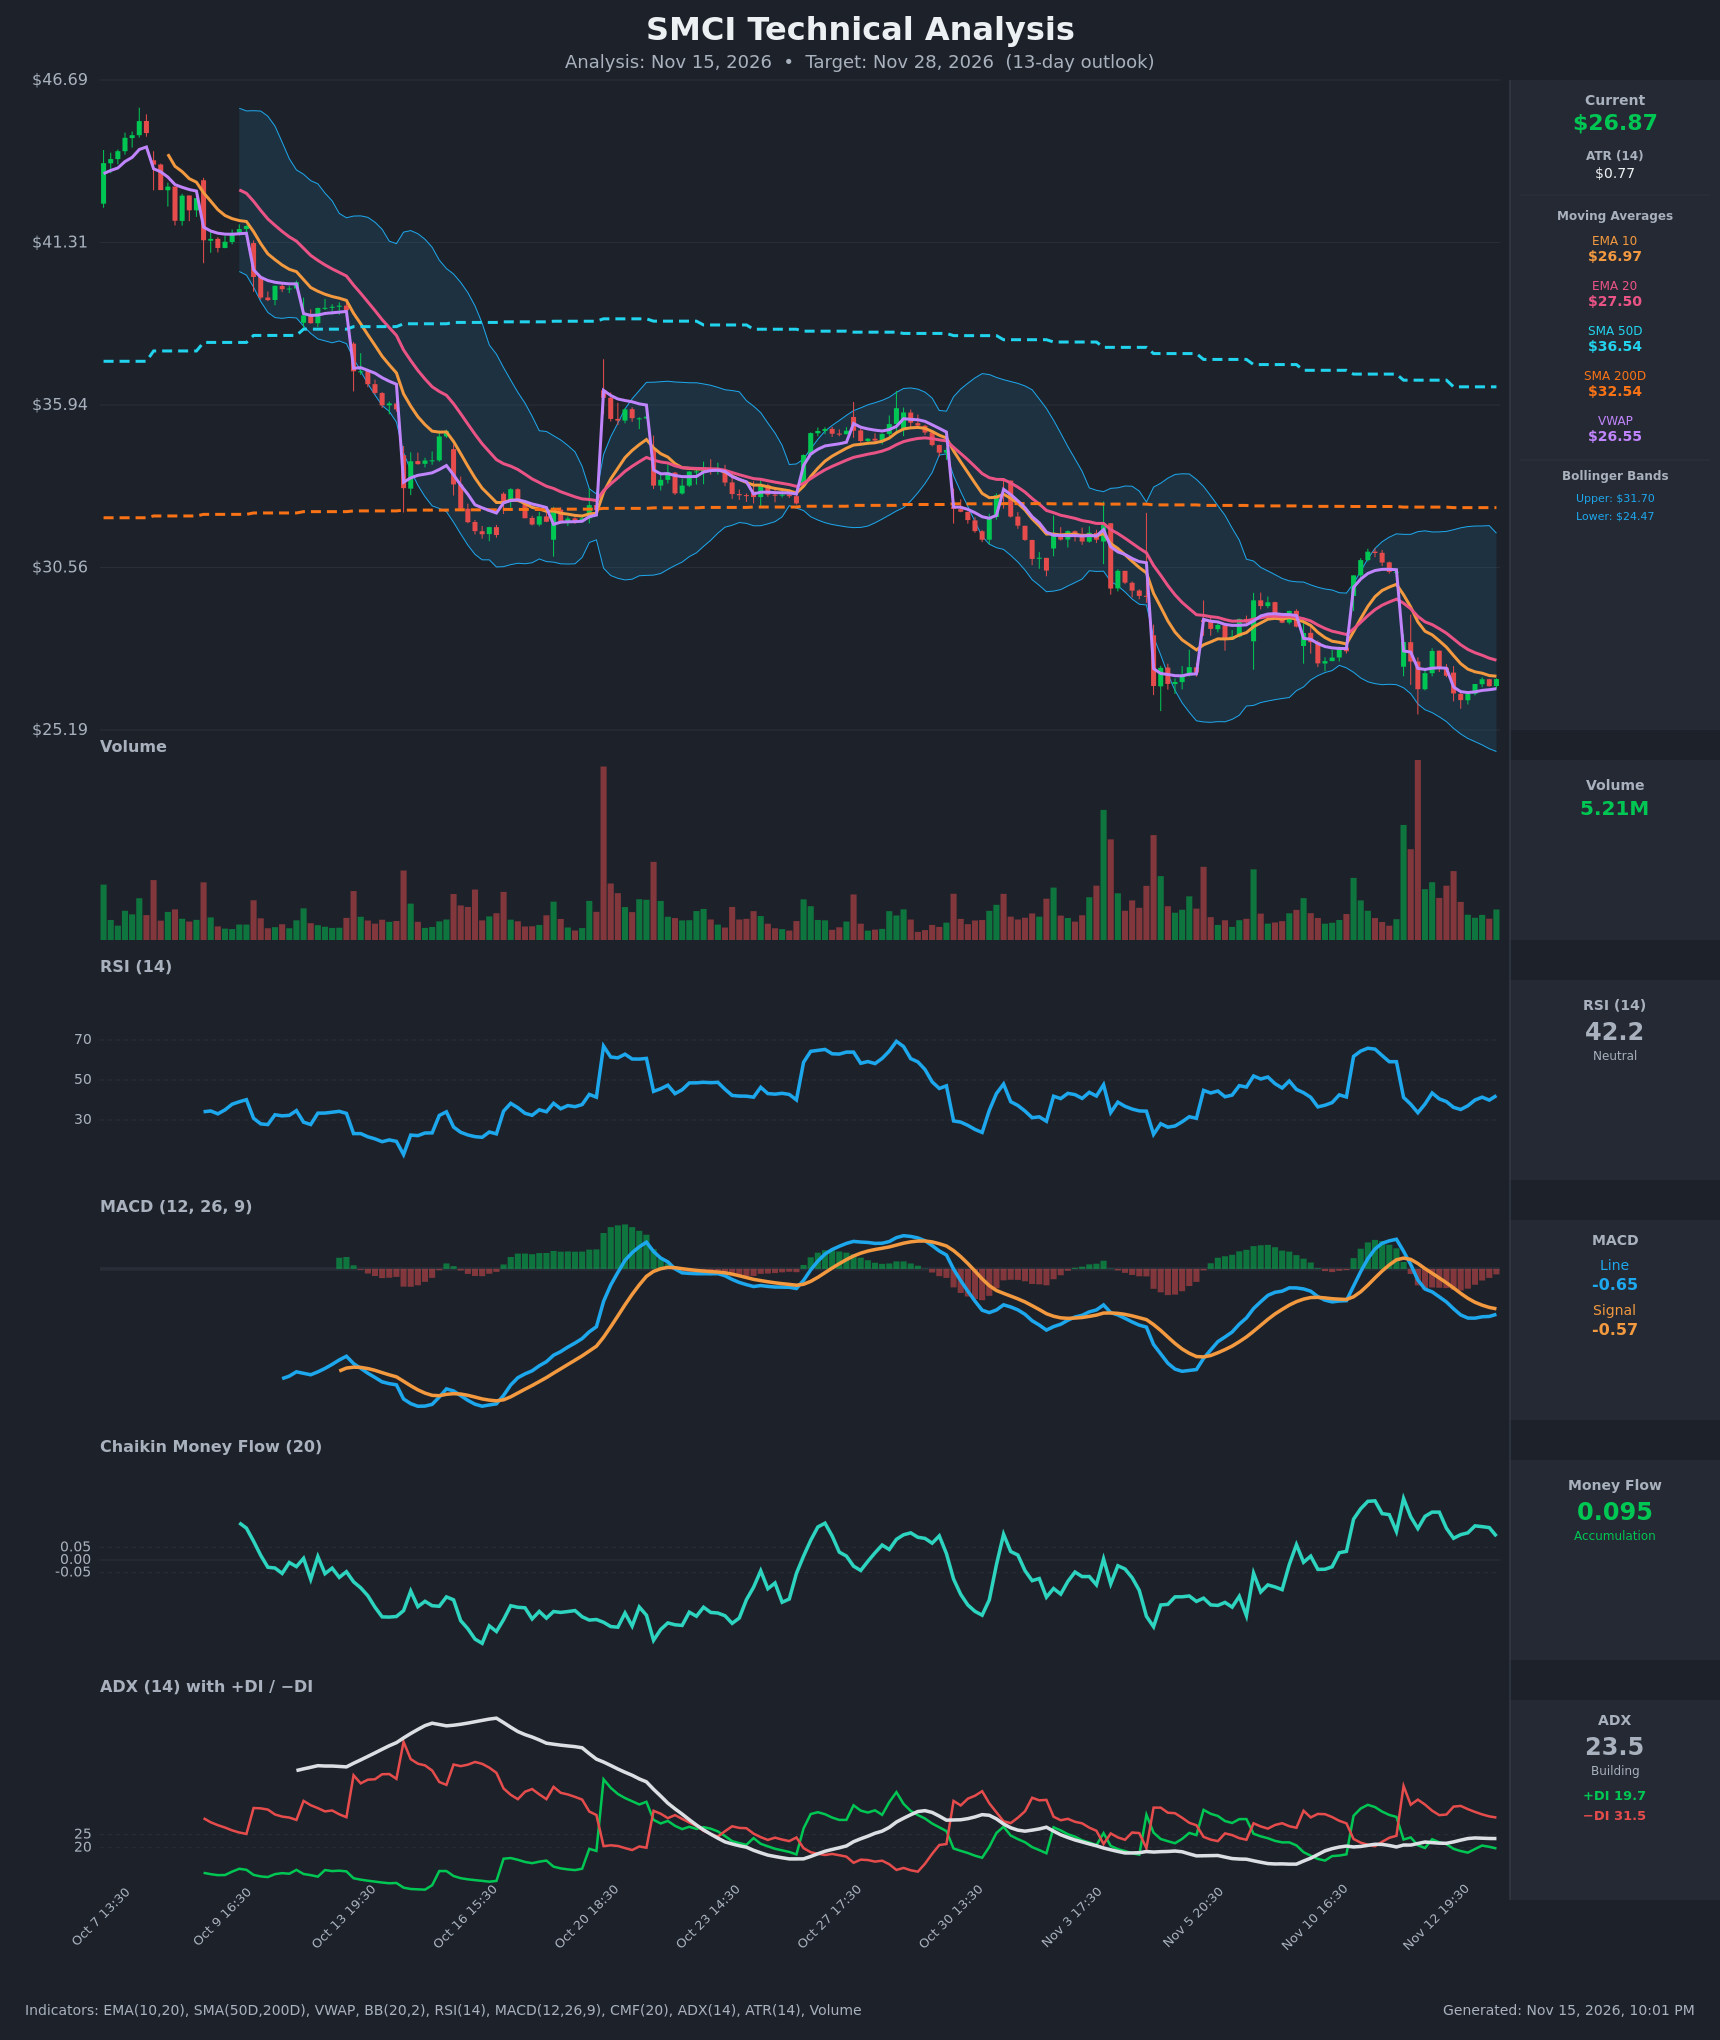
Analysis
TECHNICAL INDICATORS
- RSI (14): 42.21, below the 50 midline but well off the 33-35 lows of Nov 12-13. Momentum is a modest bounce within a bearish zone, not oversold and not yet back above 50. [Bearish]
- 20 EMA: $27.50, with EMA10 at $26.97. Price ($26.87) is below both, and EMA10 sits below EMA20, which confirms a short-term downtrend. The 20 EMA is overhead resistance, and price keeps failing to reclaim it. [Bearish]
- MACD: Line -0.651 is below signal -0.572, so it is still in a bearish configuration. The gap has narrowed from about -0.30 at its widest to -0.08, and the histogram is shrinking. This points to fading downside momentum, but no bullish crossover has happened yet. [Bearish]
- Bollinger Bands (20): Upper $31.70, lower $24.47, midline about $28.08. Price is in the lower half of the bands, about 26% of the way up. The bands are wide after the earlier selloff, so there is room for a drop toward the lower band, and no squeeze is forming. [Bearish]
- CMF (20): 0.095, above the +0.05 threshold and positive for several sessions. This is the main bullish divergence: buyers are absorbing supply near $26-27 even as price drifts lower. [Accumulation]
- ADX (14): 23.5 and slowly building, with −DI (31.5) well above +DI (19.7). The trend is approaching "strong" territory, and the bears are in control. +DI has not recovered since the Nov 12 breakdown. [Moderate Trend, Bearish]
- Volume: 5.21M, ordinary compared with the heavy spikes on the Nov 6 and Nov 12 selloff bars. Volume has faded during the consolidation near $26-27, so neither side is showing conviction. A breakdown on rising volume would be confirming. [Neutral / Fading]
DIVERGENCES & TRENDS
- CMF vs. price: CMF has risen from negative in October to +0.095 while price made lower lows. This bullish divergence suggests accumulation and a possible bottoming process, but it has not yet turned price.
- RSI: It made a higher low (about 33-35) than the October low (about 25), a mild bullish divergence. It remains below 50 and capped by the downtrend.
- MACD: The line and histogram are converging toward a possible bullish crossover. It would need price to hold $26 and reclaim the EMAs to matter.
- Moving averages: Price is far below the SMA50 ($36.54) and the SMA200 ($32.54), both of which are sloping down or flat. The SMA50 is still above the SMA200, but the gap is closing, so a death cross is likely over the coming weeks. Both averages are distant overhead resistance.
- Trend structure: Lower highs ($30.42, $28.5, $27.8) with repeated support tests near $26.2-26.5.
- VWAP: Price is slightly above VWAP ($26.55), which is a minor positive, but EMA10 has been rolling over toward price.
CHART PATTERNS
- Descending Triangle / Bearish Pennant (continuation): After the sharp drop, price is making lower highs against horizontal support around $26.2-26.5. A close below that support would project a measured move toward $24.5-25, which is also the lower Bollinger Band.
- Bearish Flag candidate: The small bounce from $26.18 sits inside a downward-sloping channel following the impulse leg lower. It is the same bearish continuation idea.
- Counter-pattern: A Bullish Falling Wedge / Double Bottom is possible if $26.2 holds and CMF accumulation continues. Confirmation would be a reclaim of $27.50 (EMA20), then $28.5-29. This is less supported by the trend and ADX/DI readings.
POTENTIAL SCENARIOS
- Scenario 1: Bearish Continuation Breakdown — Price keeps making lower highs under the 20 EMA and breaks the $26.2 support zone as MACD stays negative and −DI dominates. Trigger: a daily close below $26.20 on above-average volume. Target: $25.00, with an extension to the lower Bollinger Band near $24.50. Invalidation: a close above $27.50 (EMA20), then $28.00. (50% probability)
- Scenario 2: Bullish Relief Bounce — CMF accumulation and the narrowing MACD gap lead to a short-term reversal and a bullish MACD crossover. Trigger: a close above $27.50 with an RSI move above 50. Target: $28.50-29.00, near the Bollinger midline. Invalidation: a close below $26.00. (30% probability)
- Scenario 3: Neutral Range Chop — Price stays pinned between $26.0 and $27.5 as ADX stalls and volume fades. Trigger: repeated rejections at the EMAs and defense of $26.2. Target: $26.5-27.0. Invalidation: a break outside $25.8-$27.8. (20% probability)
PRICE TARGETS
- Target Price: $26.00 (13 days, Nov 28, 2026)
- Expected Range: $24.75 to $27.35 (width $2.60, about 9.7% of the current price, consistent with a 13-day horizon)
- Key Levels: Support at $25.50, Resistance at $27.50
OVERALL BIAS
OVERALL BIAS: BEARISH - Price is below the EMA10 and EMA20 and both major SMAs, MACD is below its signal line, and −DI (31.5) is well above +DI (19.7) with ADX building. Lower highs are pressing on $26.2 support. Positive CMF and a narrowing MACD gap argue for a bounce, but trend evidence outweighs them, so conviction is modest.
This is educational analysis and not financial advice.