SPCX 13-day bearish forecast — Nov 15, 2026
- Bias: Bearish
- Timeframe: 13 days (made Nov 15, 2026, target date Nov 27, 2026)
- Price at analysis: $139.09
- Price target: $136.00
- Expected range: $128.50 – $144.00
- Result: Pending — graded after the close on Nov 27, 2026
Get a free AI analysis of SPCX today
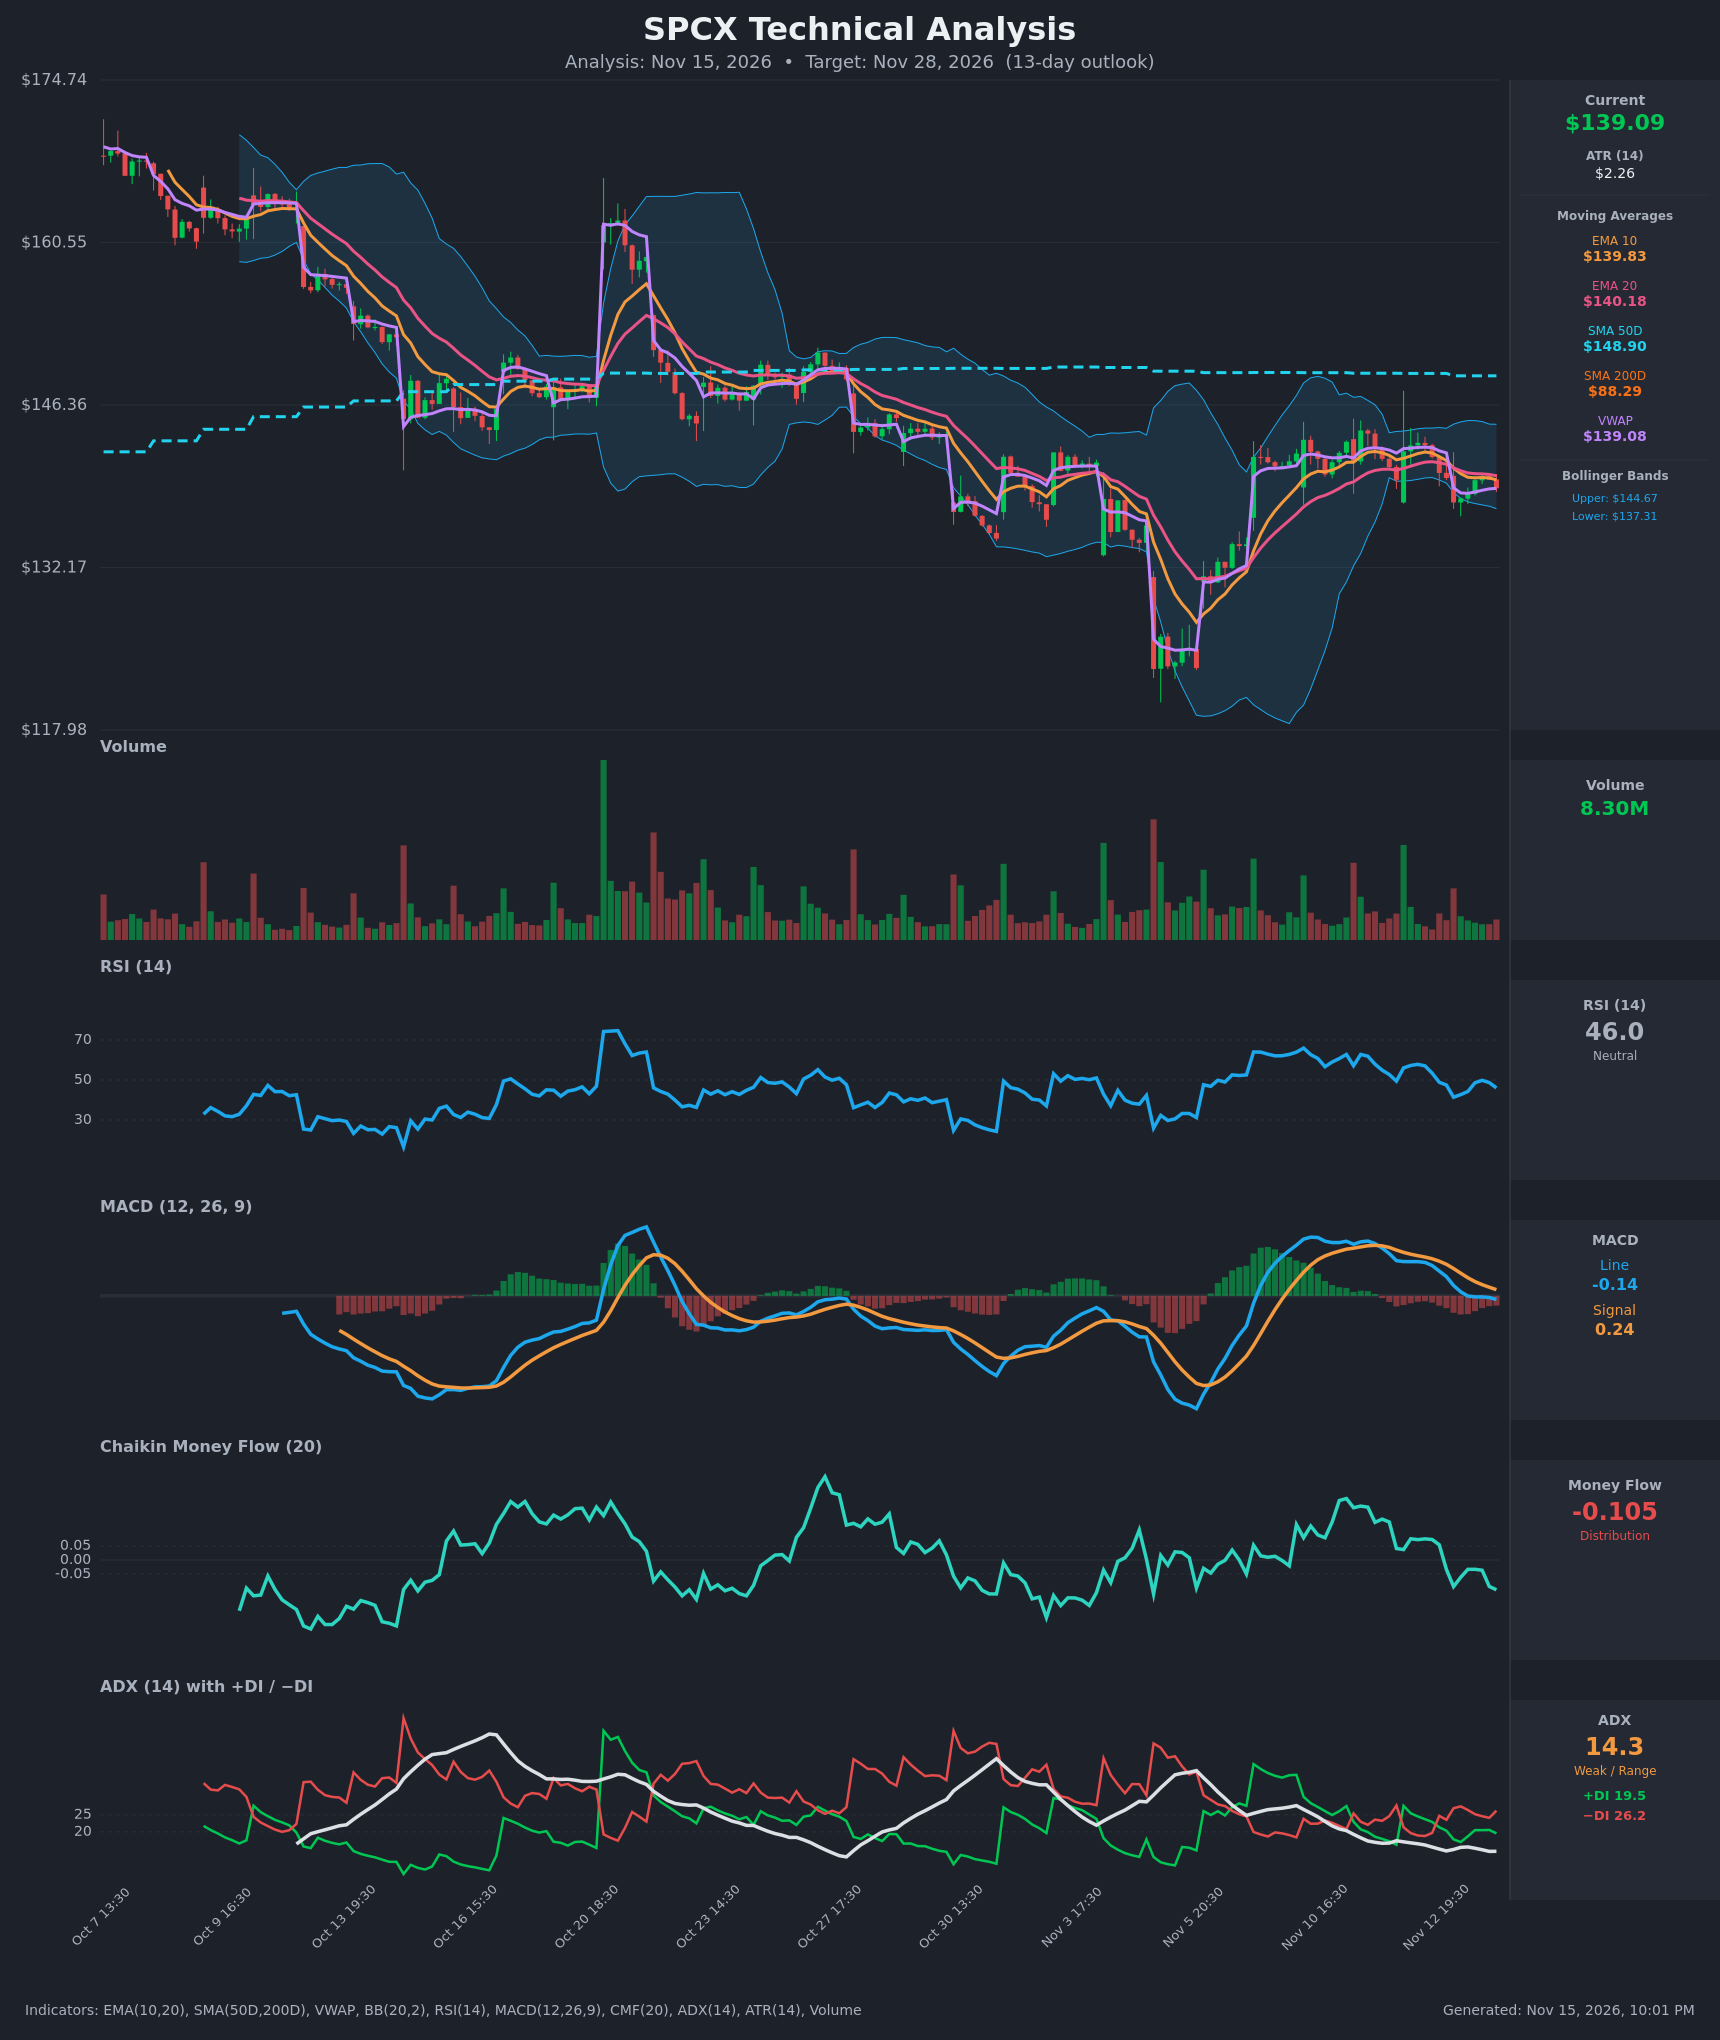
Analysis
TECHNICAL INDICATORS
- RSI (14): 46.03, just below the 50 midline. It has rolled over from ~57.8 on Nov 12 and peaked near 65 earlier in the month. Momentum is fading, with no oversold or overbought signal. [Neutral]
- 20 EMA: $140.18, with price at $139.09 just below it. EMA10 ($139.83) has crossed below EMA20 and both are sloping down. The 20 EMA is acting as near-term resistance. [Bearish]
- MACD: Line -0.144 sits below Signal 0.243. This is a fresh bearish crossover that happened on Nov 13, and the histogram has turned negative (~-0.39) and is widening. Momentum is rolling over from the early-November peak. [Bearish]
- Bollinger Bands (20): Upper $144.67, lower $137.31, with a middle band near $141. Price sits in the lower half, about 25% of the band width above the lower band. The bands have narrowed sharply from the earlier expansion, so volatility is compressing. A lower-band test is likely. [Neutral]
- CMF (20): -0.105, below the -0.05 threshold. It has dropped steadily from positive readings (+0.075) on Nov 12, showing selling pressure and distribution. [Distribution]
- ADX (14): 14.3 with −DI (26.2) above +DI (19.5). The trend is weak and range-bound, but the directional bias favors sellers. −DI regained control after the Nov 12 whipsaw. [Weak Trend, Bearish lean]
- Volume: 8.30M, below the spikes seen on earlier selloff days and in the Oct 20 rally. Recent volume is muted and there is no conviction behind the bounce attempts. Declines show slightly heavier red volume. [Neutral to mildly bearish]
DIVERGENCES & TRENDS
- Price has made a series of lower highs since early October (about $165 down to $144), which keeps the larger structure bearish. The SMA50D at $148.90 is flat and acts as overhead resistance.
- The SMA200D at $88.29 is far below price, so the long-term trend is still up. The gap between price and the 200D reflects a huge earlier run. The 50D is well above the 200D, so there is no death cross, but price is below the 50D.
- The Nov 5-6 low near $122 was followed by a V-shaped recovery to ~$143. That rally has stalled at the 50D and the upper-middle band.
- MACD has crossed bearishly, +DI/−DI have flipped back to bearish, and CMF has turned negative. All three are moving the same way, which is a bearish confirmation, though the weak ADX limits conviction.
- There is no clear RSI/price divergence. Price held near $140 while RSI faded from 57 to 46, which is mild momentum deterioration.
- VWAP at $139.08 is almost exactly at price, so price sits at fair value intraday. A break below VWAP would be a mild bearish tilt.
CHART PATTERNS
- Price has been consolidating in a tightening range of roughly $137.5–$143 after the V-shaped bounce. This most resembles a Bearish Pennant / Bearish Flag from the reference diagram (a weak bounce after a sharp drop), with a tentative Bearish Rising Wedge element in the lower-high structure on the bounce.
- The pennant implies a downside resolution toward the prior flagpole range. The measured move is partial, with a first target at the $132–$133 area, and the bigger target is the $122–$125 prior low.
- The pattern is not confirmed until price closes decisively below ~$137.3 (the lower Bollinger Band and the recent range floor).
- Invalidation of the bearish read would be a close above the SMA50D at ~$149, which would suggest a Bullish Double Bottom or reversal structure.
POTENTIAL SCENARIOS
- Scenario 1: Bearish Pennant Breakdown — Price loses the lower band and consolidation floor as −DI stays in control and CMF stays negative. Trigger: close below $137.30 on rising volume. Target: $132.50–$133.50. Invalidation: reclaim of $142.50 (above the EMAs). (50% probability)
- Scenario 2: Neutral Range Chop — ADX stays below 20 and price oscillates between the lower band and the EMA cluster, with VWAP acting as a pivot. Trigger: failure to break either $137.30 or $143. Target: $138–$141. Invalidation: a close outside $136.50–$144. (28% probability)
- Scenario 3: Bullish Recovery Toward the 50D — Buyers defend $137 and push back through the EMAs, with MACD curling up. Trigger: close above $142.50 with volume expansion. Target: $146–$148.90. Invalidation: close back below $137.30. (22% probability)
PRICE TARGETS
- Target Price: $136.00 (13-day)
- Expected Range: $128.50 to $144.00 (width $15.50, about 11.1% of current price, which fits the 8-12% guidance for 14-21 days and is scaled slightly down for 13 days)
- Key Levels: Support at $137.31 (lower Bollinger Band, then $132.50), Resistance at $140.18 (20 EMA, then $144.67 and the SMA50D at $148.90)
OVERALL BIAS
OVERALL BIAS: BEARISH - MACD has crossed bearishly, −DI is above +DI, CMF is in distribution at -0.105, and price is below both EMAs in a bearish pennant-style consolidation under a flat SMA50D. The weak ADX (14.3) tempers conviction, so the expected downside is modest.
This is educational analysis and not financial advice.