TQQQ 13-day bearish forecast — Nov 15, 2026
- Bias: Bearish
- Timeframe: 13 days (made Nov 15, 2026, target date Nov 27, 2026)
- Price at analysis: $57.67
- Price target: $56.20
- Expected range: $53.50 – $59.60
- Result: Pending — graded after the close on Nov 27, 2026
Get a free AI analysis of TQQQ today
Analysis
TECHNICAL INDICATORS
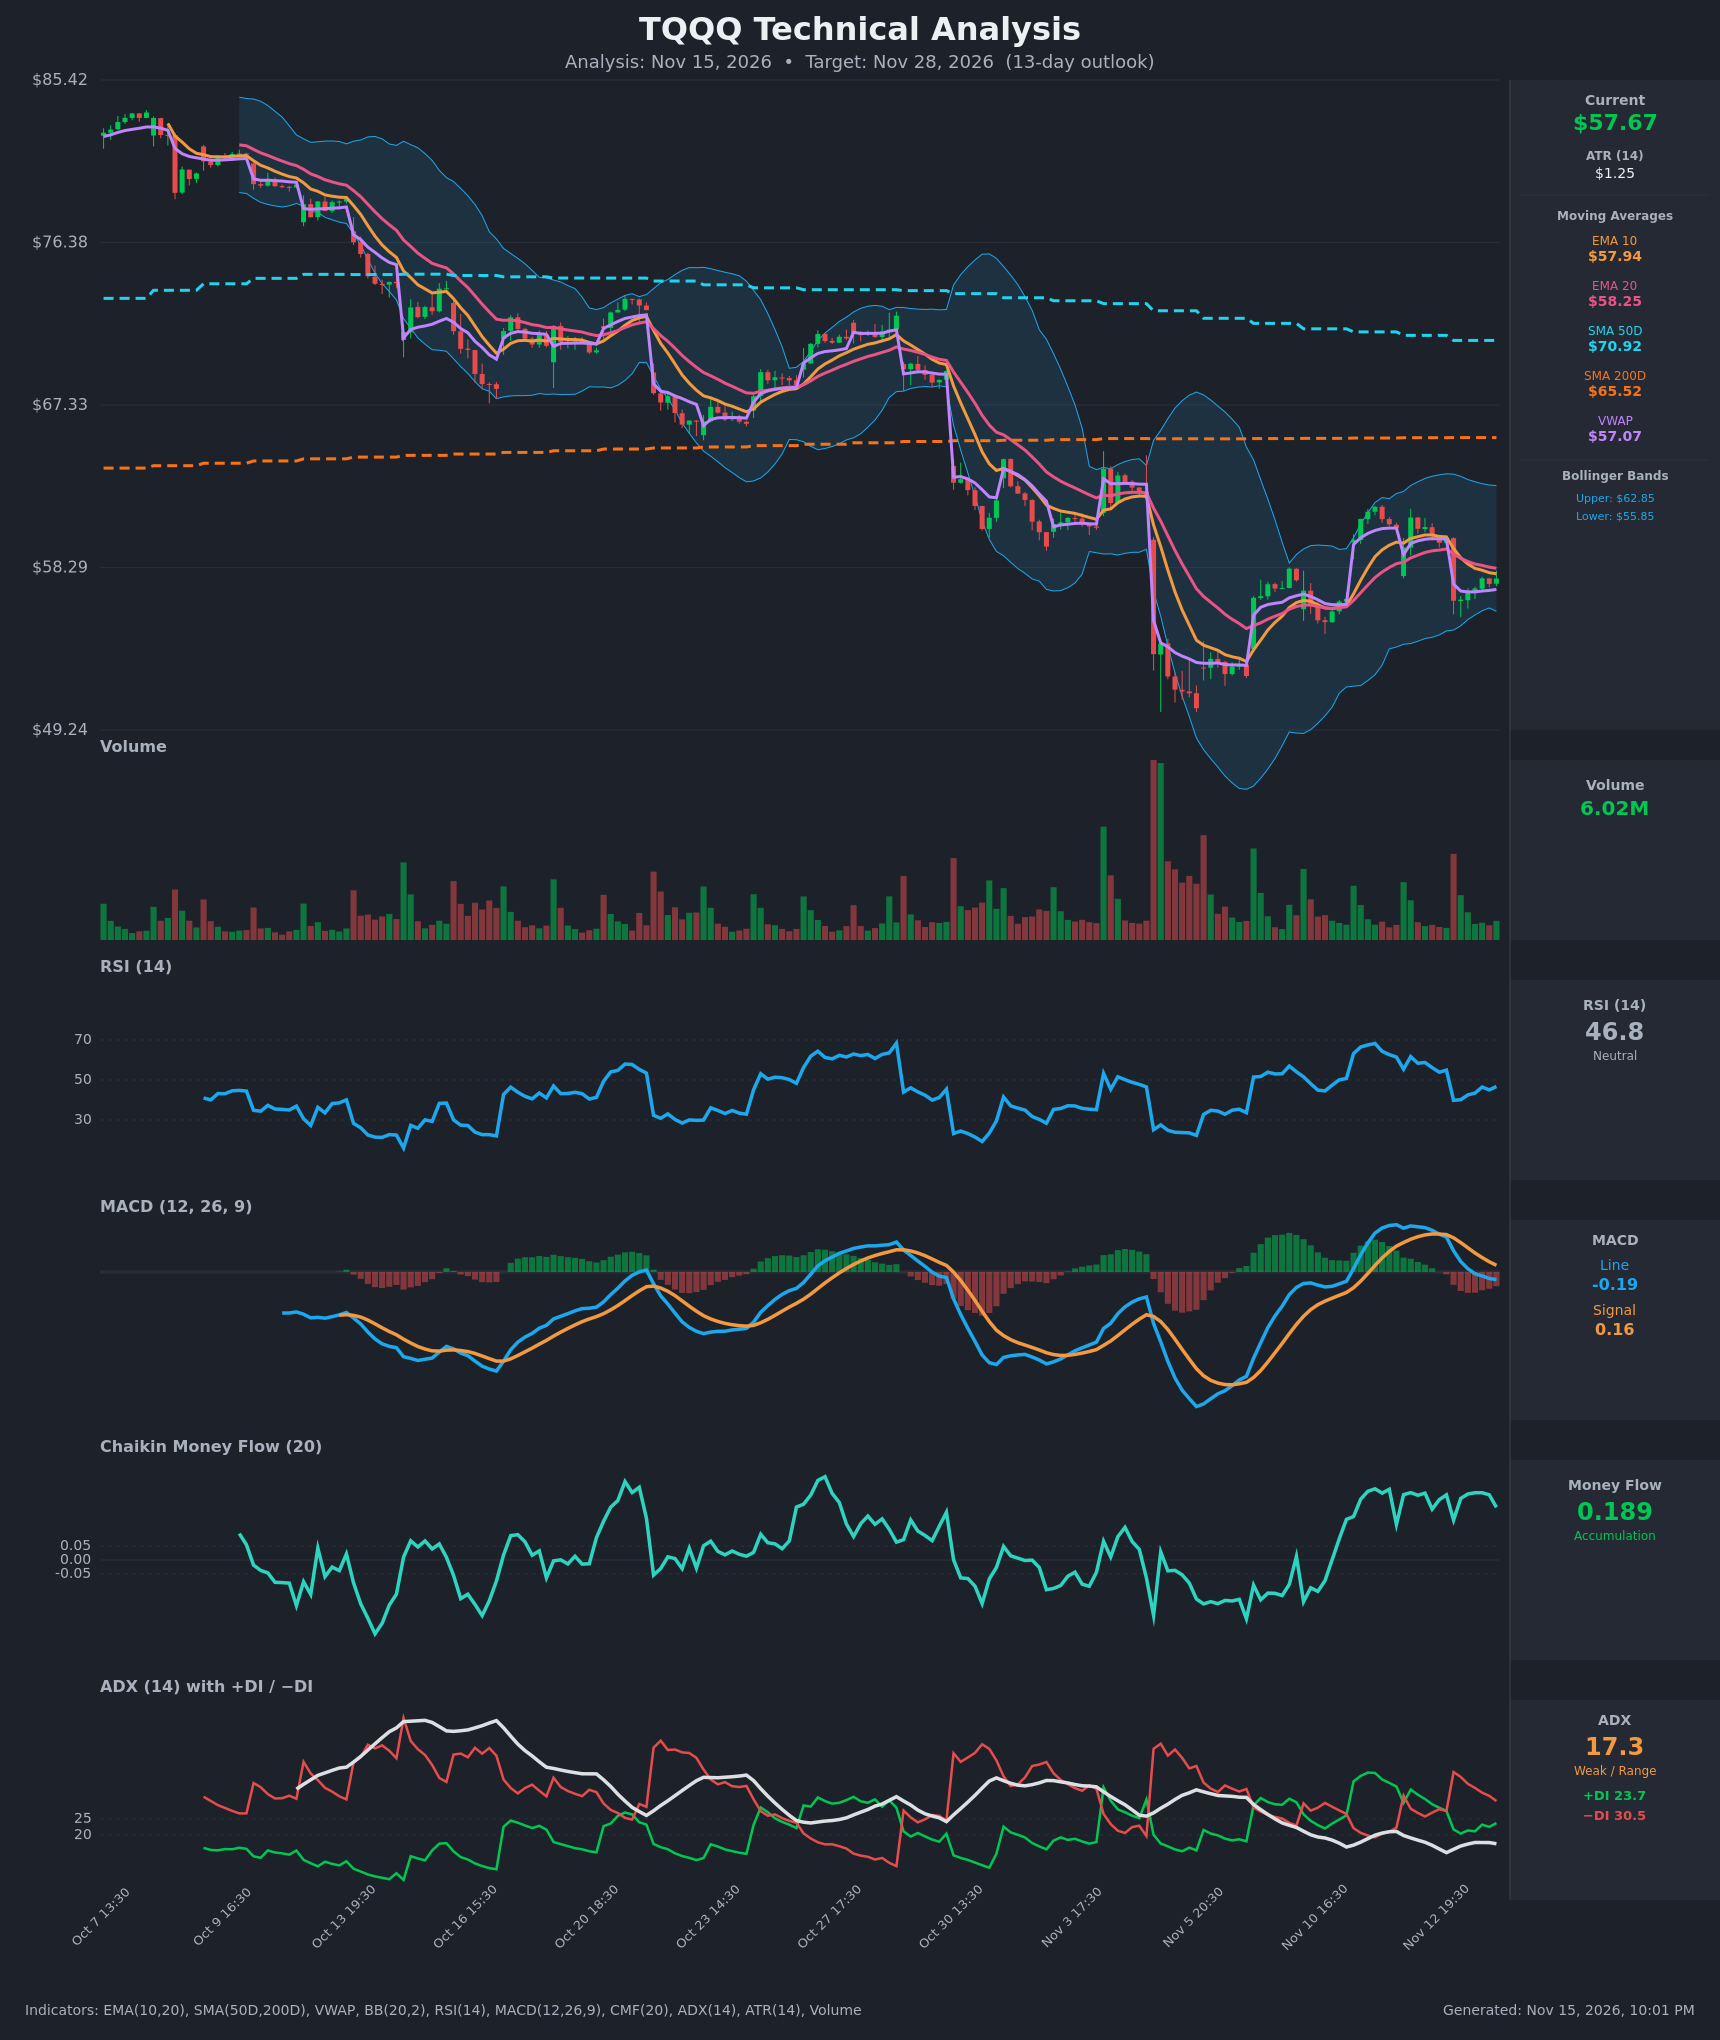
- RSI (14): 46.75, just under the 50 midline. It fell from about 67 on Nov 10-11 to under 40 on the Nov 13 gap-down, and has only partly recovered (about 40 to 47). Momentum is neutral with a slight bearish tilt, and there is no oversold or overbought extreme. [Neutral]
- 20 EMA: $58.25, with the 10 EMA at $57.94 just below it. Price at $57.67 is under both, so they act as overhead resistance. The 10 EMA crossed below the 20 EMA around Nov 13 (a short-term bearish cross). Price is also well below the SMA50 ($70.92) and SMA200 ($65.52). [Bearish]
- MACD: Line -0.186 is below Signal 0.163, and the histogram is negative and widening. The bearish crossover happened on Nov 13 (the line fell from +1.16 to -0.19 in a few sessions). Both lines are rolling over from a failed rally. [Bearish]
- Bollinger Bands (20): Upper $62.85, lower $55.85, so the midline is about $59.35. Price sits in the lower half of the bands, below the midline, which signals a mild downward bias. The bands have narrowed from the earlier expansion, so volatility is compressing. [Bearish]
- CMF (20): +0.189, well above the +0.05 threshold. It has held at +0.13 to +0.24 for the whole recent window, which suggests dip buying and accumulation despite the weak price. [Accumulation]
- ADX (14): 17.3 and falling, so the trend is weak or range-bound. −DI (30.5) is above +DI (23.7), so sellers have the edge. The −DI lead widened sharply after the Nov 13 gap down. [Weak Trend, bearish lean]
- Volume: 6.02M, modest and below the capitulation spike near the $51 low. The heavy red volume on the gap-down and the lighter volume in the rebound suggest the bounce is not convincing. [Neutral to slightly bearish]
- VWAP: $57.07, with price just above it ($57.67). This is a small plus for buyers, but the gap is thin. [Neutral]
DIVERGENCES & TRENDS
- Bullish divergence (CMF vs price): CMF is near its highs (+0.19) while price made a lower high at about $61 versus the rally peak. Money flow is stronger than price action, which argues against a deep collapse.
- Bearish momentum: MACD crossed down and the histogram is deepening. The EMA10 is below the EMA20. −DI is above +DI.
- Moving average structure: Price is below the SMA50 and SMA200. The SMA50 ($70.92) is still above the SMA200 ($65.52) but falling and converging, so a death cross is a medium-term risk. The long-term trend remains down from the $85 area.
- Price structure: The Nov 5 low of about $51 held, and price rebounded to about $61. It then made a lower high and gapped down on Nov 13 to $56.4. The pullback is holding above that gap-day low and the lower Bollinger Band, so it is still a bounce within a larger downtrend.
- ADX under 20: There is no strong trend, so moves may be choppy, but the DI lean is bearish.
CHART PATTERNS
- Bearish Flag / Pennant (low to moderate confidence): After the sharp Nov 13 drop from about $59.9 to $56.4, price is drifting sideways to slightly up in a narrow channel of $56.4 to $58. A break below $56.4 would project toward about $53, which is the measured move of roughly $3.5.
- Larger lower-high sequence: The decline from $85 through $71 and $62 has made consistently lower highs. This is a broad descending structure, and the $51 low is the major floor.
- Possible Bullish Double Bottom (speculative): The $51 low and a retest could form one, but that would need a hold above $55 and a break of the neckline near $61. Neither has happened yet.
POTENTIAL SCENARIOS
- Scenario 1: Bearish Flag Breakdown — Price fails at the EMA20 and breaks the post-gap range. MACD stays negative and −DI stays dominant. Trigger: close below $56.40, then below the lower Bollinger Band at $55.85. Target: $54.00 to $53.00 (the $51 low is a deeper test). Invalidation: a daily close above $59.40, which is the Bollinger midline and above the EMA20. (50% probability)
- Scenario 2: Bullish Accumulation Rebound — CMF accumulation wins out and price reclaims the EMAs and the Bollinger midline. Trigger: close above $58.25, then above $59.40. Target: $60.50 to $62.00 (the upper band and the recent high). Invalidation: loss of $56.40. (32% probability)
- Scenario 3: Neutral Range Chop — A weak ADX of 17 keeps price in a $56 to $59 range. Trigger: repeated rejections at $58.25 and holds at $56.40. Target: $57 to $58. Invalidation: a close outside $55.85 to $59.40. (18% probability)
PRICE TARGETS
Range width check: $59.60 − $53.50 = $6.10, which is 10.6% of $57.67. This fits the 13-day guidance of roughly 8 to 12%.
- Target Price: $56.20 (13 days, about 2.5% below current)
- Expected Range: $53.50 to $59.60
- Key Levels: Support at $55.85 (lower Bollinger Band, just under the $56.40 gap-day low), Resistance at $58.25 (EMA20)
OVERALL BIAS
OVERALL BIAS: BEARISH - Price is below the key moving averages, MACD has crossed down, and −DI leads +DI. The post-gap pattern looks like a weak bounce or flag in a larger downtrend. Strong CMF accumulation and a hold above VWAP limit the downside, so conviction is modest.
This is educational analysis and not financial advice.