TLT 13-day bearish forecast — Nov 15, 2026
- Bias: Bearish
- Timeframe: 13 days (made Nov 15, 2026, target date Nov 27, 2026)
- Price at analysis: $79.37
- Price target: $78.70
- Expected range: $75.90 – $81.70
- Result: Pending — graded after the close on Nov 27, 2026
Get a free AI analysis of TLT today
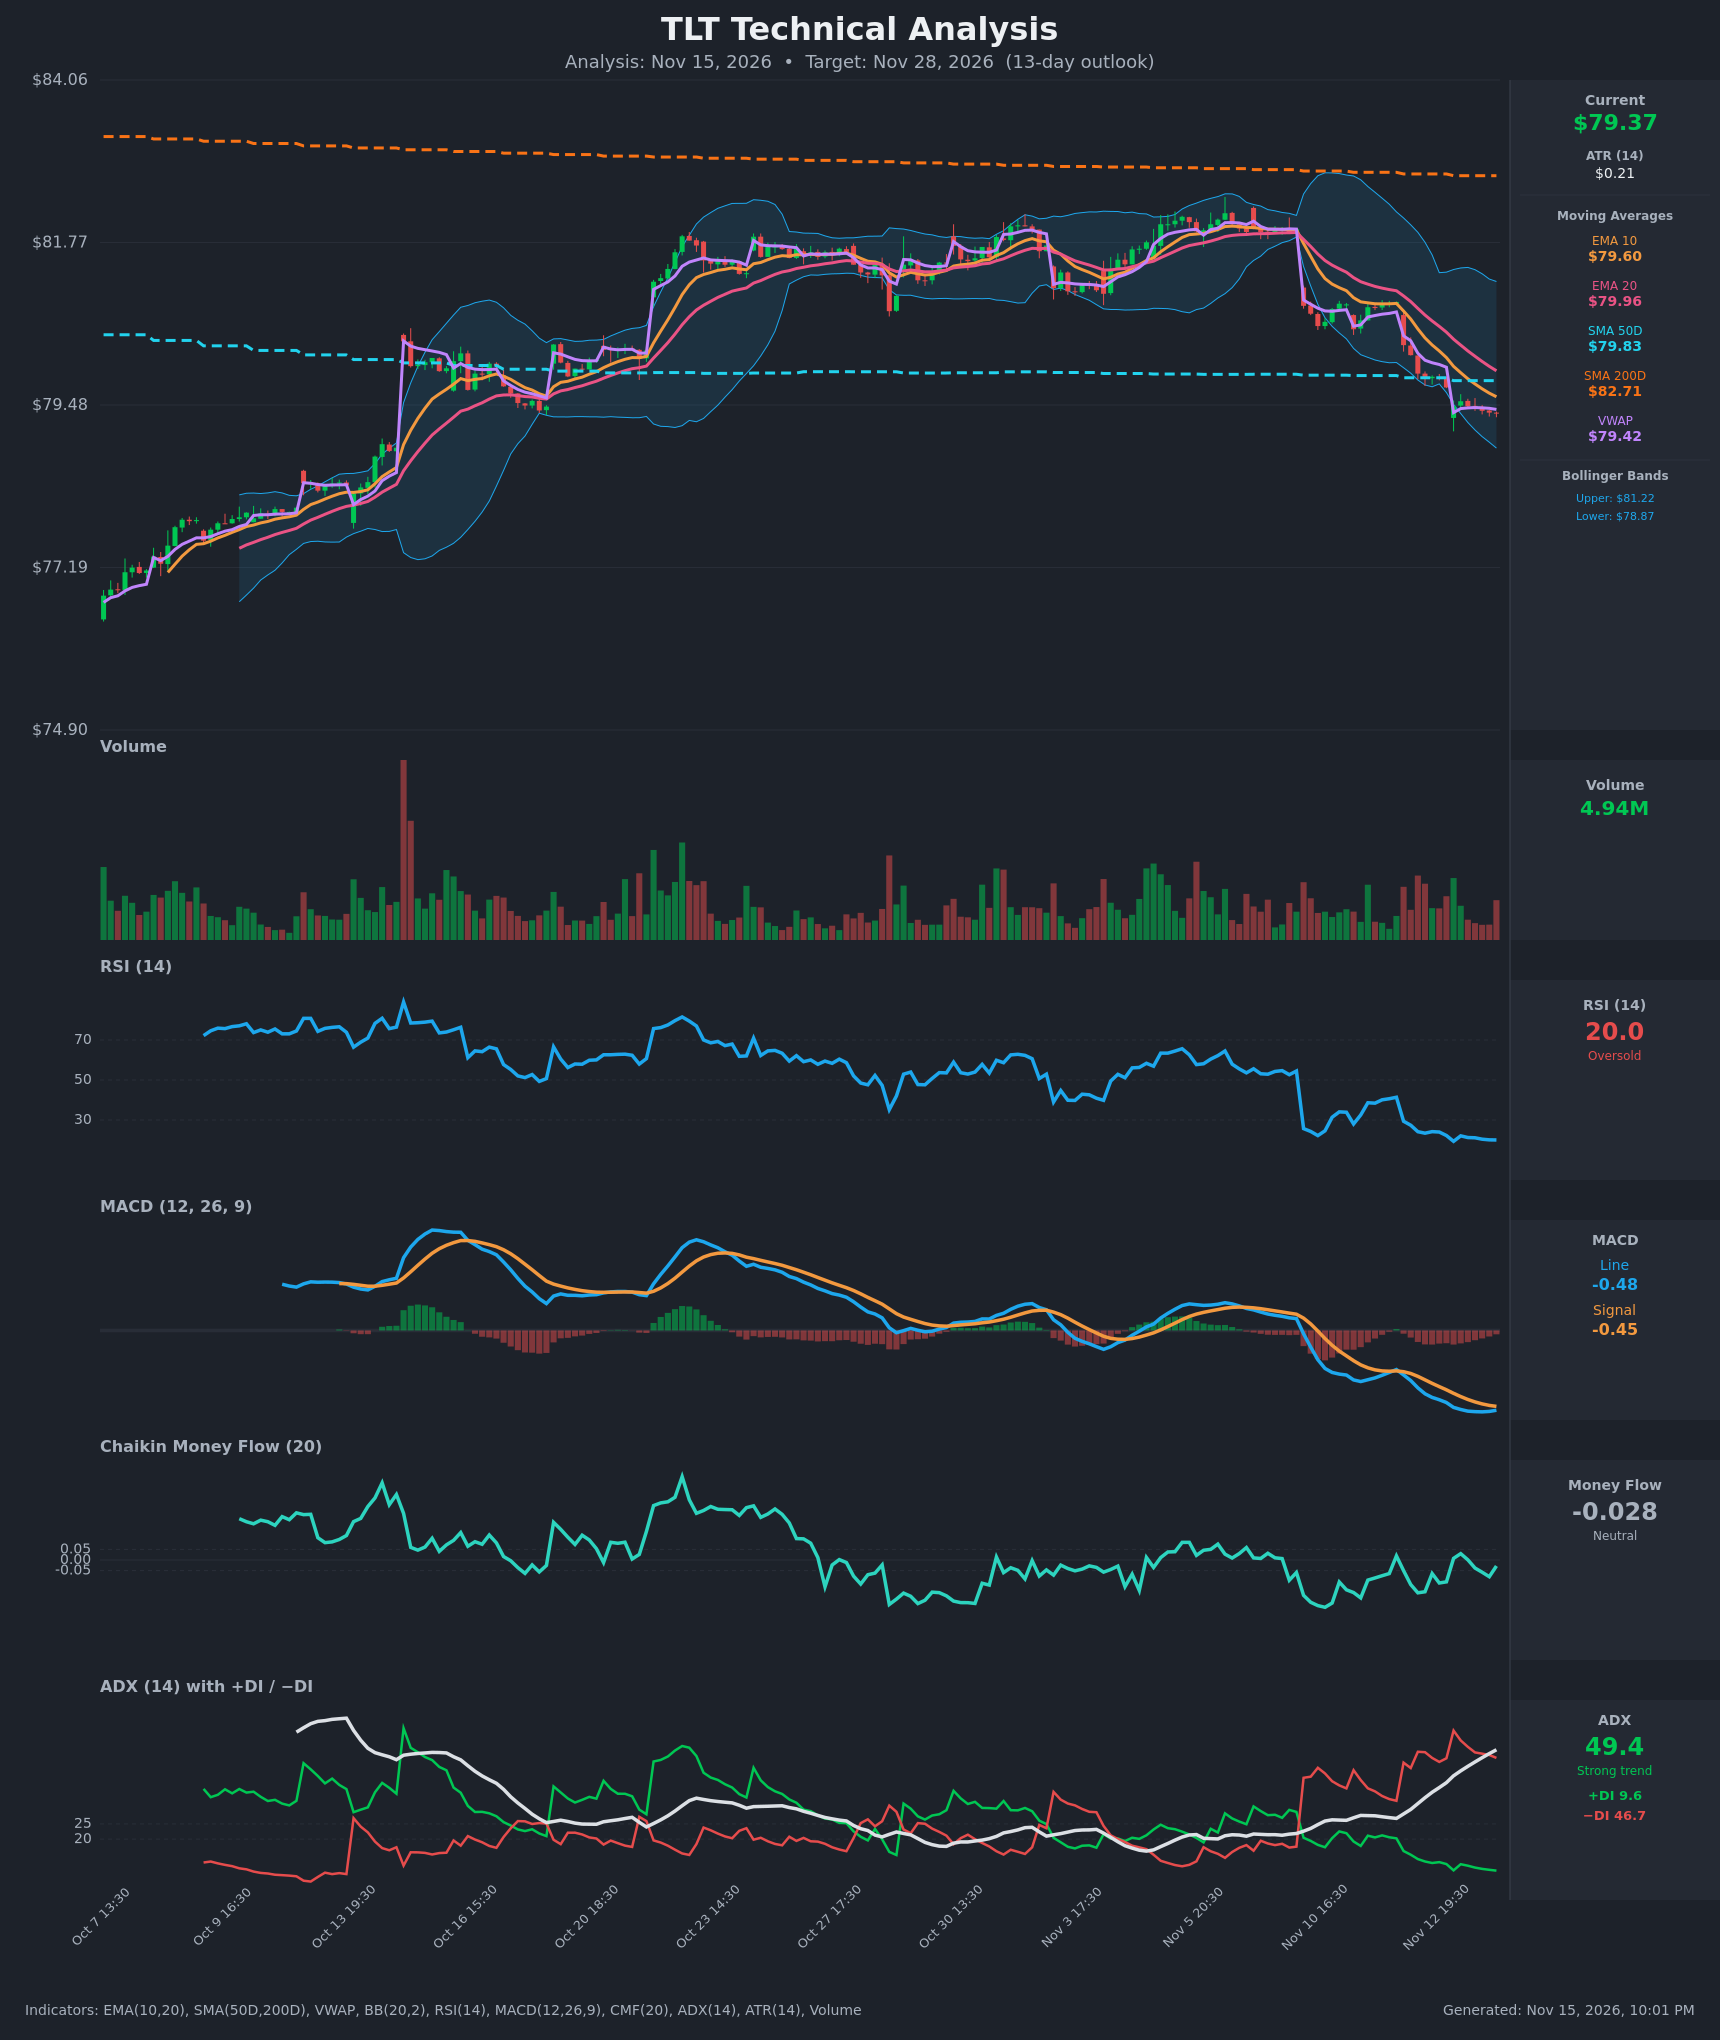
Analysis
TECHNICAL INDICATORS
- RSI (14): 20.01, deeply oversold and near the 19.3 low from Nov 13. It has been below 30 since Nov 12 and has made no real recovery, though the slightly higher RSI on a lower price (20.0 at $79.37 vs 19.3 at $79.47) hints at fading downside momentum. [Bearish] (trend), with a warning of a relief bounce.
- 20 EMA: $79.96, with EMA10 at $79.60 below it. Price at $79.37 is below both, and EMA20 has acted as resistance since the Nov 12 breakdown. [Bearish]
- MACD: Line -0.476 is below signal -0.453, so it is a bearish setup. The histogram is -0.023 and has narrowed for six bars from about -0.084, and the line has ticked up from -0.486. A bullish crossover could come soon, but nothing has crossed yet. [Bearish] (momentum fading)
- Bollinger Bands (20): Upper $81.22, lower $78.87, with price at $79.37 in the lower quarter of the band. The bands expanded sharply on the gap-down, and price has been walking the lower band. [Bearish]
- CMF (20): -0.028, between ±0.05. It has bounced between -0.15 and +0.03 over the last 15 bars, so selling pressure is not clearly dominant. [Neutral]
- ADX (14): 49.4 and rising steadily from 26.8, with −DI 46.7 far above +DI 9.6. This is a very strong, mature downtrend. ADX readings near 50 often mark exhaustion zones, but the trend is intact. [Strong Trend – Bearish]
- Volume: 4.94M, with no capitulation spike. The volume bars on the decline are moderate and the gap-down was not accompanied by a clear climactic surge. [Neutral to mildly Bearish]
Other levels:
- SMA50D is $79.83, and price has just broken below it.
- SMA200D is $82.71, well overhead.
- VWAP is $79.42, with price slightly below it.
- Death cross: SMA50D is below SMA200D, which is a long-term bearish structure.
DIVERGENCES & TRENDS
- Possible bullish divergence: RSI is making a marginally higher low (20.0 vs 19.3) as price makes a lower low ($79.37 vs $79.47). The MACD histogram is also contracting. Both point to slowing downside momentum, not a confirmed reversal.
- Trend: The EMA10/EMA20 bearish cross is established. Price fell through the SMA50D and is below all key averages. ADX is rising with −DI dominant.
- Crossovers and breaks: Price broke below the Oct–Nov consolidation range ($80.8–$82.3) with a gap-down. A MACD bullish cross is approaching but is not confirmed.
- Extremes: An RSI near 20 combined with price at the lower Bollinger band raises the odds of a dead-cat bounce toward the EMA10/VWAP/SMA50 cluster ($79.6–$80.0).
CHART PATTERNS
- Range breakdown (Bearish Triple Top / rectangle-type reversal): Price repeatedly failed near $82.3 and then broke below the range floor around $80.8. The measured move from range height (~$1.5) projects toward roughly $79.3, and the move has largely played out. An extension would need a fresh leg below $78.87.
- Descending staircase after the gap: Lower highs and lower lows since Nov 12 form a bearish continuation structure, similar to a Bearish Flag or Pennant, if a small bounce forms below $79.96.
- No bullish reversal pattern such as a double bottom is confirmed yet.
POTENTIAL SCENARIOS
- Scenario 1: Bearish Trend Continuation — The strong ADX and −DI dominance keep price pressed along the lower Bollinger band, and any bounce stalls at the EMA20/SMA50 resistance zone. Trigger: Break below $78.87 (lower band) or a rejection at $79.83–$79.96. Target: $78.20–$78.70, with an extension to $77.20. Invalidation: Daily close above $80.00. (50% probability)
- Scenario 2: Bullish Oversold Relief Bounce — An RSI near 20 and a MACD histogram that is shrinking toward a bullish cross trigger mean reversion toward the moving averages. Trigger: A move above $79.83 (SMA50D) and then $79.96 (EMA20). Target: $80.40–$80.90. Invalidation: Break below $78.87. (38% probability)
- Scenario 3: Neutral Base Building — Price chops between $78.80 and $80.00 as the selling pressure fades. Trigger: Sustained closes between support and the SMA50. Target: $79.30–$79.60. Invalidation: Close outside $78.60–$80.20. (12% probability)
PRICE TARGETS
- Target Price: $78.70 (13-day)
- Expected Range: $75.90 to $81.70 (width $5.80, about 7.3% of the current price)
- Key Levels: Support at $78.87, Resistance at $79.83
OVERALL BIAS
OVERALL BIAS: BEARISH - A very strong ADX of 49.4 with −DI far above +DI, price below all key moving averages, a death-cross structure and the range breakdown favor continuation lower. Conviction is modest because an RSI of 20 and a shrinking MACD histogram raise the risk of a relief bounce toward $79.8–$80.4.
This is educational analysis and not financial advice.