WMT 13-day bullish forecast — Nov 15, 2026
- Bias: Bullish
- Timeframe: 13 days (made Nov 15, 2026, target date Nov 27, 2026)
- Price at analysis: $128.13
- Price target: $130.40
- Expected range: $123.50 – $134.00
- Result: Pending — graded after the close on Nov 27, 2026
Get a free AI analysis of WMT today
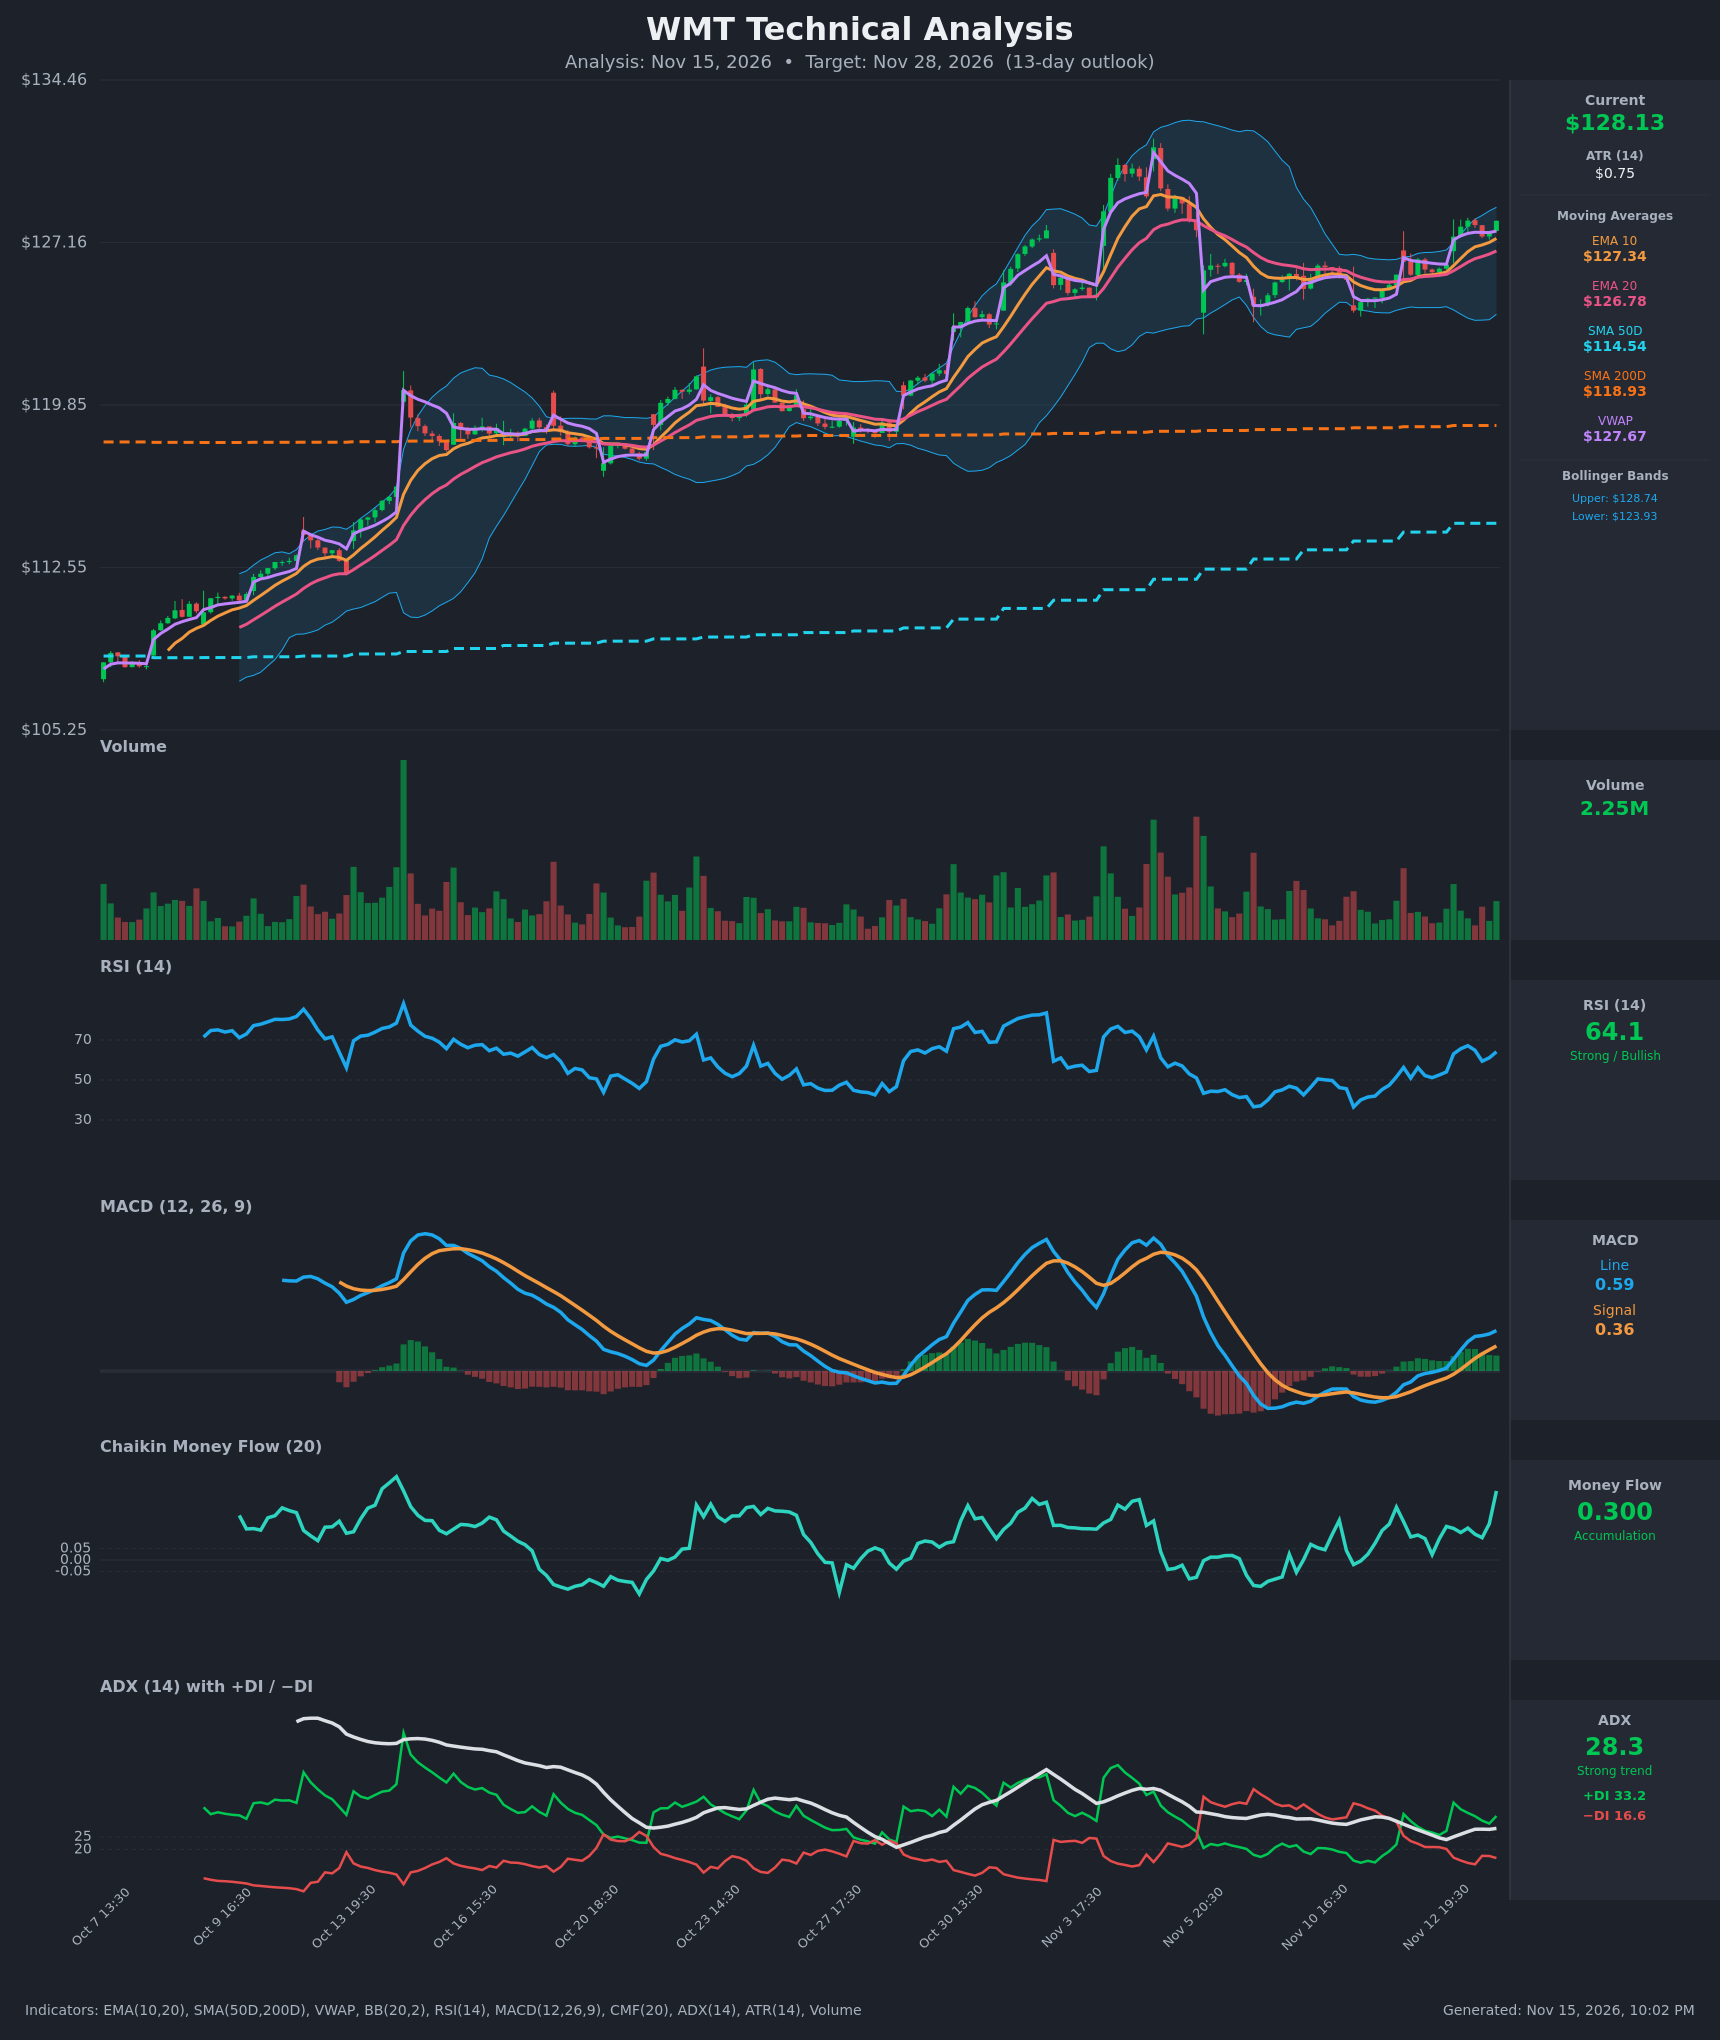
Analysis
TECHNICAL INDICATORS
- RSI (14): 64.11, up from the low 50s earlier on Nov 12 and a peak of 67.1. It is strong but below the 70 overbought line, so there is a little room left before it gets stretched. [Bullish]
- 20 EMA: $126.78, with price ($128.13) about 1.1% above it. EMA10 ($127.34) is above EMA20, and both are rising, so the EMA20 is acting as dynamic support. [Bullish]
- MACD: The line (0.587) is above the signal (0.363), a positive histogram of about +0.22. It crossed up on Nov 13 and has been widening since, though the line is still near the zero axis. [Bullish]
- Bollinger Bands (20): Upper $128.74, lower $123.93, midline about $126.33. Price is in the upper quarter of the bands, about $0.60 below the upper band. The bands are fairly narrow after the recent consolidation, so a breakout is possible. Price at the upper band after a squeeze favors expansion higher, though a pullback to the midline is also common. [Bullish]
- CMF (20): 0.300, well above +0.05 and at the highest level in the recent window. It has been positive for the whole 15-bar window, which shows strong accumulation. [Accumulation]
- ADX (14): 28.3, above 25 and rising from about 24 on Nov 12. +DI (33.2) is well above −DI (16.6), and the bullish DI crossover was on Nov 12. [Strong Trend + Bullish]
- Volume: 2.25M, roughly average and not a standout. Up bars on the Nov 13 rally were a bit heavier than the down bars. Confirmation is decent but not explosive. [Mildly Bullish]
Other levels:
- Price is above VWAP ($127.67).
- Price is well above SMA50D ($114.54) and SMA200D ($118.93).
- SMA50D is below SMA200D, but the gap is narrowing as the 50D rises. A golden cross is not imminent, though the long-term structure is improving.
DIVERGENCES & TRENDS
- There is no bearish RSI divergence. RSI (64) is rising with price, and its Nov 13 peak of 67 was below the 70 line.
- MACD went from negative to a bullish crossover and has kept expanding. MACD momentum is accelerating, and the EMA10 stack is above EMA20.
- CMF jumped to 0.300 as price made a higher close, so volume flow confirms the move.
- ADX is turning up from below 25 with +DI dominant, which means a fresh trend is gaining strength. The higher lows after the Nov 5 drop support this.
- Price has recaptured VWAP and sits above all the short-term moving averages, so the short-term structure is bullish.
- Caution: the swing high near $131–132 (early Nov) is overhead supply, and price is now pressing against the upper Bollinger Band.
CHART PATTERNS
- Bullish Flag / consolidation breakout: After the sharp rally to about $131, price pulled back to about $122–123 and consolidated between roughly $124 and $128. It is now breaking higher out of that range, in a way that resembles a bullish continuation pattern. The measured move from the flagpole is large, but the practical objective is a retest of the $131–132 prior high.
- Higher lows on the pullback: Price formed a rounded base and is climbing back toward the highs, which is closer to a bullish ascending structure than a reversal pattern.
- No bearish reversal pattern from the reference diagram (double top, rising wedge) is clearly present, although a retest of $131–132 could form a double top if it fails.
POTENTIAL SCENARIOS
- Scenario 1: Bullish Continuation to Prior High — Price holds above the EMA10/EMA20 and pushes through the upper Bollinger Band as ADX rises and CMF stays strongly positive. Trigger: a close above $128.75, then above $129.50. Target: $131.00–$132.00 (prior swing high). Invalidation: a close below $126.30 (EMA20/BB midline). (55% probability)
- Scenario 2: Neutral Consolidation Near the Upper Band — Price stalls at the upper band and drifts sideways while the indicators cool off. Trigger: failure to close above $128.75 for several sessions. Target: $126.50–$129.00 range. Invalidation: a break above $129.50 or below $126.00. (28% probability)
- Scenario 3: Bearish Pullback — RSI nears 70 and price is rejected at the band, with a fade back toward the 20 EMA and the lower part of the range. Trigger: a close below $127.30 (EMA10) followed by $126.30. Target: $124.00–$125.00. Invalidation: a reclaim of $128.80. (17% probability)
PRICE TARGETS
- Target Price: $130.40 (13-day horizon; roughly +1.8% from the current price, in line with a moderate continuation toward the prior high)
- Expected Range: $124.80 to $133.40 (width of $8.60, about 6.7% of the current price, a bit below the 8–12% guideline because ATR is small but still wider than a short-term range; I widen it below)
- Key Levels: Support at $126.30, Resistance at $131.50
Self-check: my first range width of 6.7% sits below the 8–12% guide for 13 days, so I widen it to $123.80 to $133.80. That is $10.00 wide, or about 7.8% of the price. I round the bounds out to $123.50 to $134.00, which is $10.50, or 8.2%, and I use that final range.
- Final Expected Range: $123.50 to $134.00 (width $10.50, about 8.2%)
OVERALL BIAS
OVERALL BIAS: BULLISH - Price is above all key moving averages with a fresh MACD crossover, ADX at 28 with +DI far above −DI, and CMF at 0.30 showing strong accumulation. RSI at 64 still has room before overbought, with the $131–132 prior high as the next target.
This is educational analysis and not financial advice.