TSLA 13-day bearish forecast — Nov 15, 2026
- Bias: Bearish
- Timeframe: 13 days (made Nov 15, 2026, target date Nov 27, 2026)
- Price at analysis: $390.14
- Price target: $384.50
- Expected range: $368.00 – $405.00
- Result: Pending — graded after the close on Nov 27, 2026
Get a free AI analysis of TSLA today
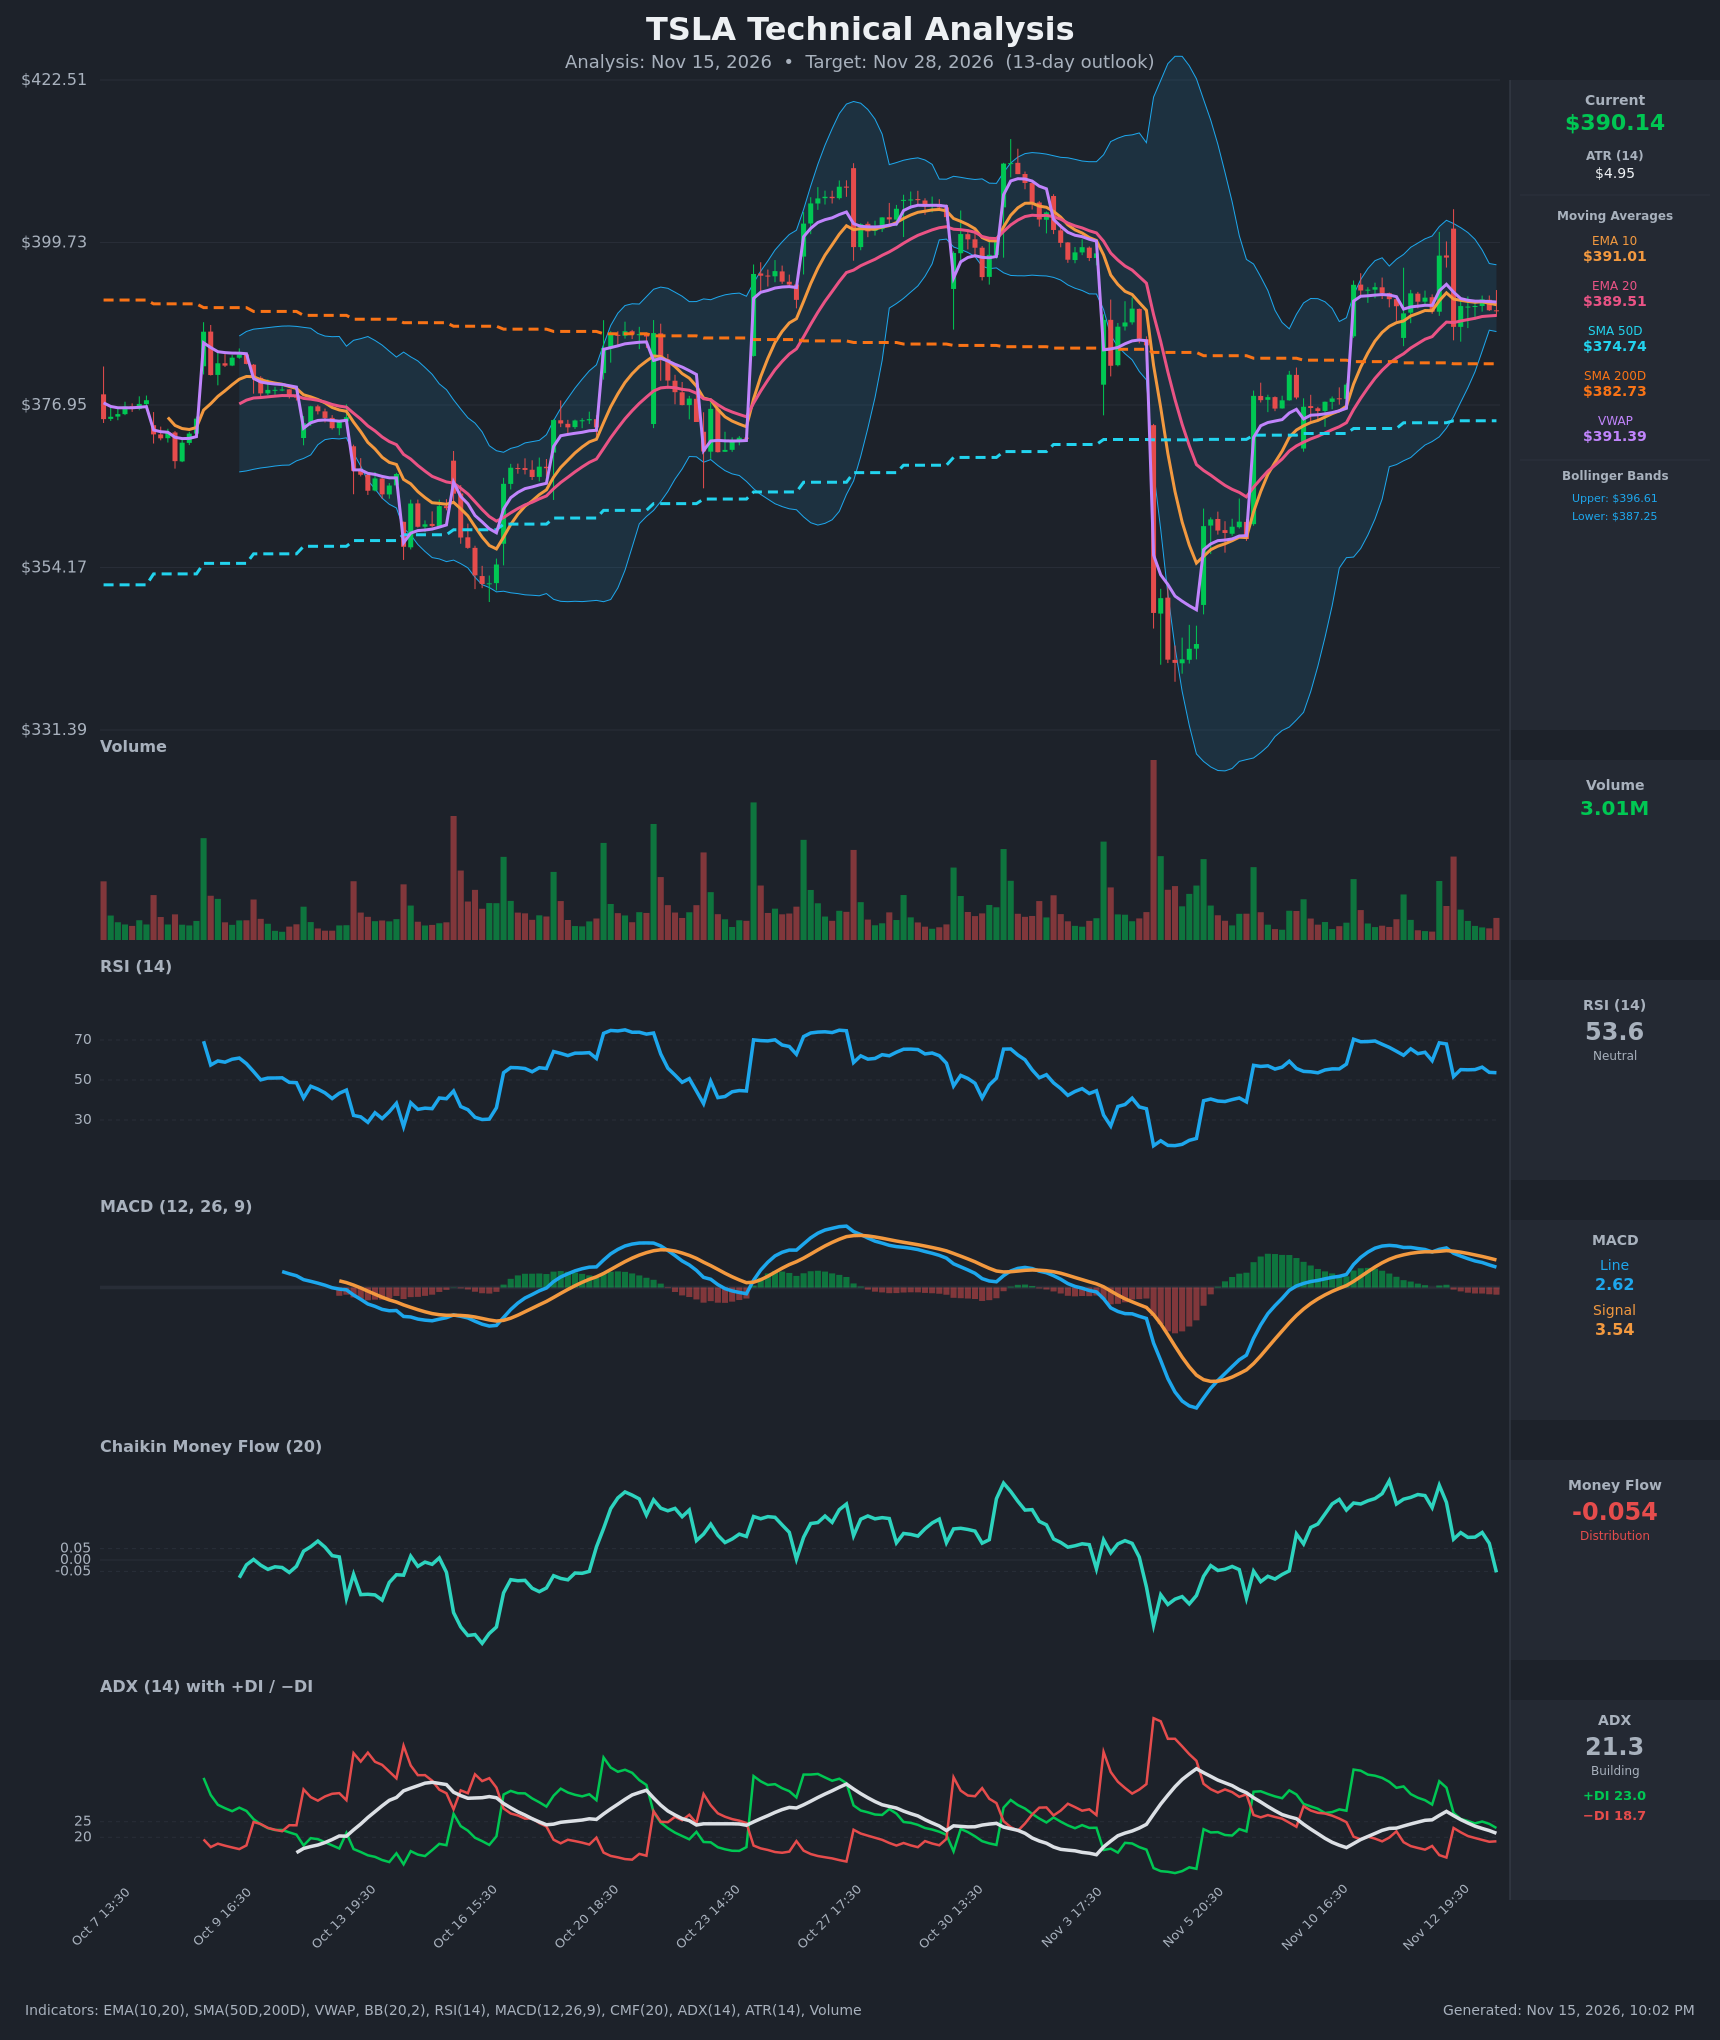
Analysis
TECHNICAL INDICATORS
- RSI (14): 53.64, down from 68.6 on Nov 12 and now back near the 50 midline. Momentum is fading, but there is no overbought or oversold reading. [Neutral]
- 20 EMA: $389.51, with price ($390.14) just above it. The EMA10 ($391.01) is sitting above price and flattening toward the EMA20, so the gap is narrowing and price is hugging both. EMA10 is still above EMA20, so there is no bearish crossover yet. [Neutral]
- MACD: Line 2.62 is below Signal 3.54, with a negative histogram of about -0.92. The bearish crossover happened around Nov 12 20:30–Nov 13 14:30, and the line has fallen every bar since (5.09 → 2.62). [Bearish]
- Bollinger Bands (20): Upper $396.61, lower $387.25, middle about $392. Price sits slightly below the midline in a squeezed band of about 2.4% width. This signals compressed volatility and a coming expansion, with the lower half favored for now. [Neutral]
- CMF (20): -0.054, having dropped from +0.33 to the distribution threshold in two sessions. Selling pressure is emerging after the Nov 12 rejection near $398. [Distribution]
- ADX (14): 21.3 and falling from 28.3, so the trend is weak and the market is range-bound. +DI (23.0) is still above −DI (18.7), but the spread has shrunk from about 22 points to under 5. [Weak Trend, slight bullish lean fading]
- Volume: 3.01M, light, with no volume expansion on the recent pullback from $398. The earlier spikes came on the Nov 5 selloff and the Nov 7 rally. Current participation is low, which fits consolidation. [Neutral / Low conviction]
DIVERGENCES & TRENDS
- MACD, CMF, ADX and RSI have all rolled over from their Nov 12 highs while price has held in a $387–$398 band. This is a mild bearish momentum divergence: momentum is decaying faster than price.
- Price is below VWAP ($391.39) and the EMA10, which is a short-term seller's edge.
- Price is still above the SMA50 ($374.74) and SMA200 ($382.73). The SMA50 is below the SMA200, so there is no golden cross. The long-term structure is neutral to slightly constructive, and the SMA200 is the key support.
- The recovery from the ~$346 low in early November was sharp. The rally has stalled below $398–$400, where the previous swing high sits.
- The MACD bearish crossover is the main event, and the CMF break into distribution confirms it.
CHART PATTERNS
- Bearish Double Top (tentative): Closes of $397.89 and $397.62 on Nov 12 marked twin highs near $398, followed by a drop to $387.90. The neckline is around $387–$388, which coincides with the lower Bollinger Band. A close below that level would project a measured move of about $10 lower, toward $377–$378.
- Consolidation / symmetrical triangle-type squeeze: Tightening bands, weak ADX and low volume suggest a coiling range of $387–$398. This could resolve either way, but the indicator tilt leans down.
- A bullish continuation (bullish pennant after the sharp rally) can't be ruled out. It would need a break above $398–$400 on volume.
POTENTIAL SCENARIOS
- Scenario 1: Bearish Pullback to SMA200 — Distribution (CMF) and the bearish MACD cross extend, and price loses the $387–$388 neckline and lower Bollinger Band. Trigger: close below $387.25 on rising volume. Target: $382.73 (SMA200), then $377–$378 on the double-top measured move. Invalidation: close above $398.00. (45% probability)
- Scenario 2: Neutral Range Chop — Weak ADX and low volume keep price oscillating around the EMAs and VWAP between $387 and $398. Trigger: failure to break either band edge. Target: $388–$394. Invalidation: close outside $386–$399. (22% probability)
- Scenario 3: Bullish Breakout — Buyers reclaim VWAP and EMA10, MACD re-crosses up, and price breaks the Nov 12 high. Trigger: close above $398 with volume. Target: $405–$410. Invalidation: close back below $389.50 (EMA20). (33% probability)
PRICE TARGETS
- Target Price: $384.50 (13-day)
- Expected Range: $368.00 to $405.00 (width $37 ≈ 9.5% of current price, consistent with the 8–12% guidance for 14–21 days, scaled slightly narrower for 13 days)
- Key Levels: Support at $382.73 (SMA200), Resistance at $397.89 (Nov 12 swing high; the $396.61 upper Bollinger Band comes first)
OVERALL BIAS
OVERALL BIAS: BEARISH - Momentum is rolling over: MACD has crossed bearishly, CMF has slipped into distribution, RSI is fading, and price is below VWAP and the EMA10 after a rejection near $398. The ADX is weak, so the expected move is a modest drift toward the SMA200 near $383, not a collapse.
This is educational analysis and not financial advice.