XLE 13-day bullish forecast — Nov 15, 2026
- Bias: Bullish
- Timeframe: 13 days (made Nov 15, 2026, target date Nov 27, 2026)
- Price at analysis: $64.94
- Price target: $65.70
- Expected range: $62.90 – $67.60
- Result: Pending — graded after the close on Nov 27, 2026
Get a free AI analysis of XLE today
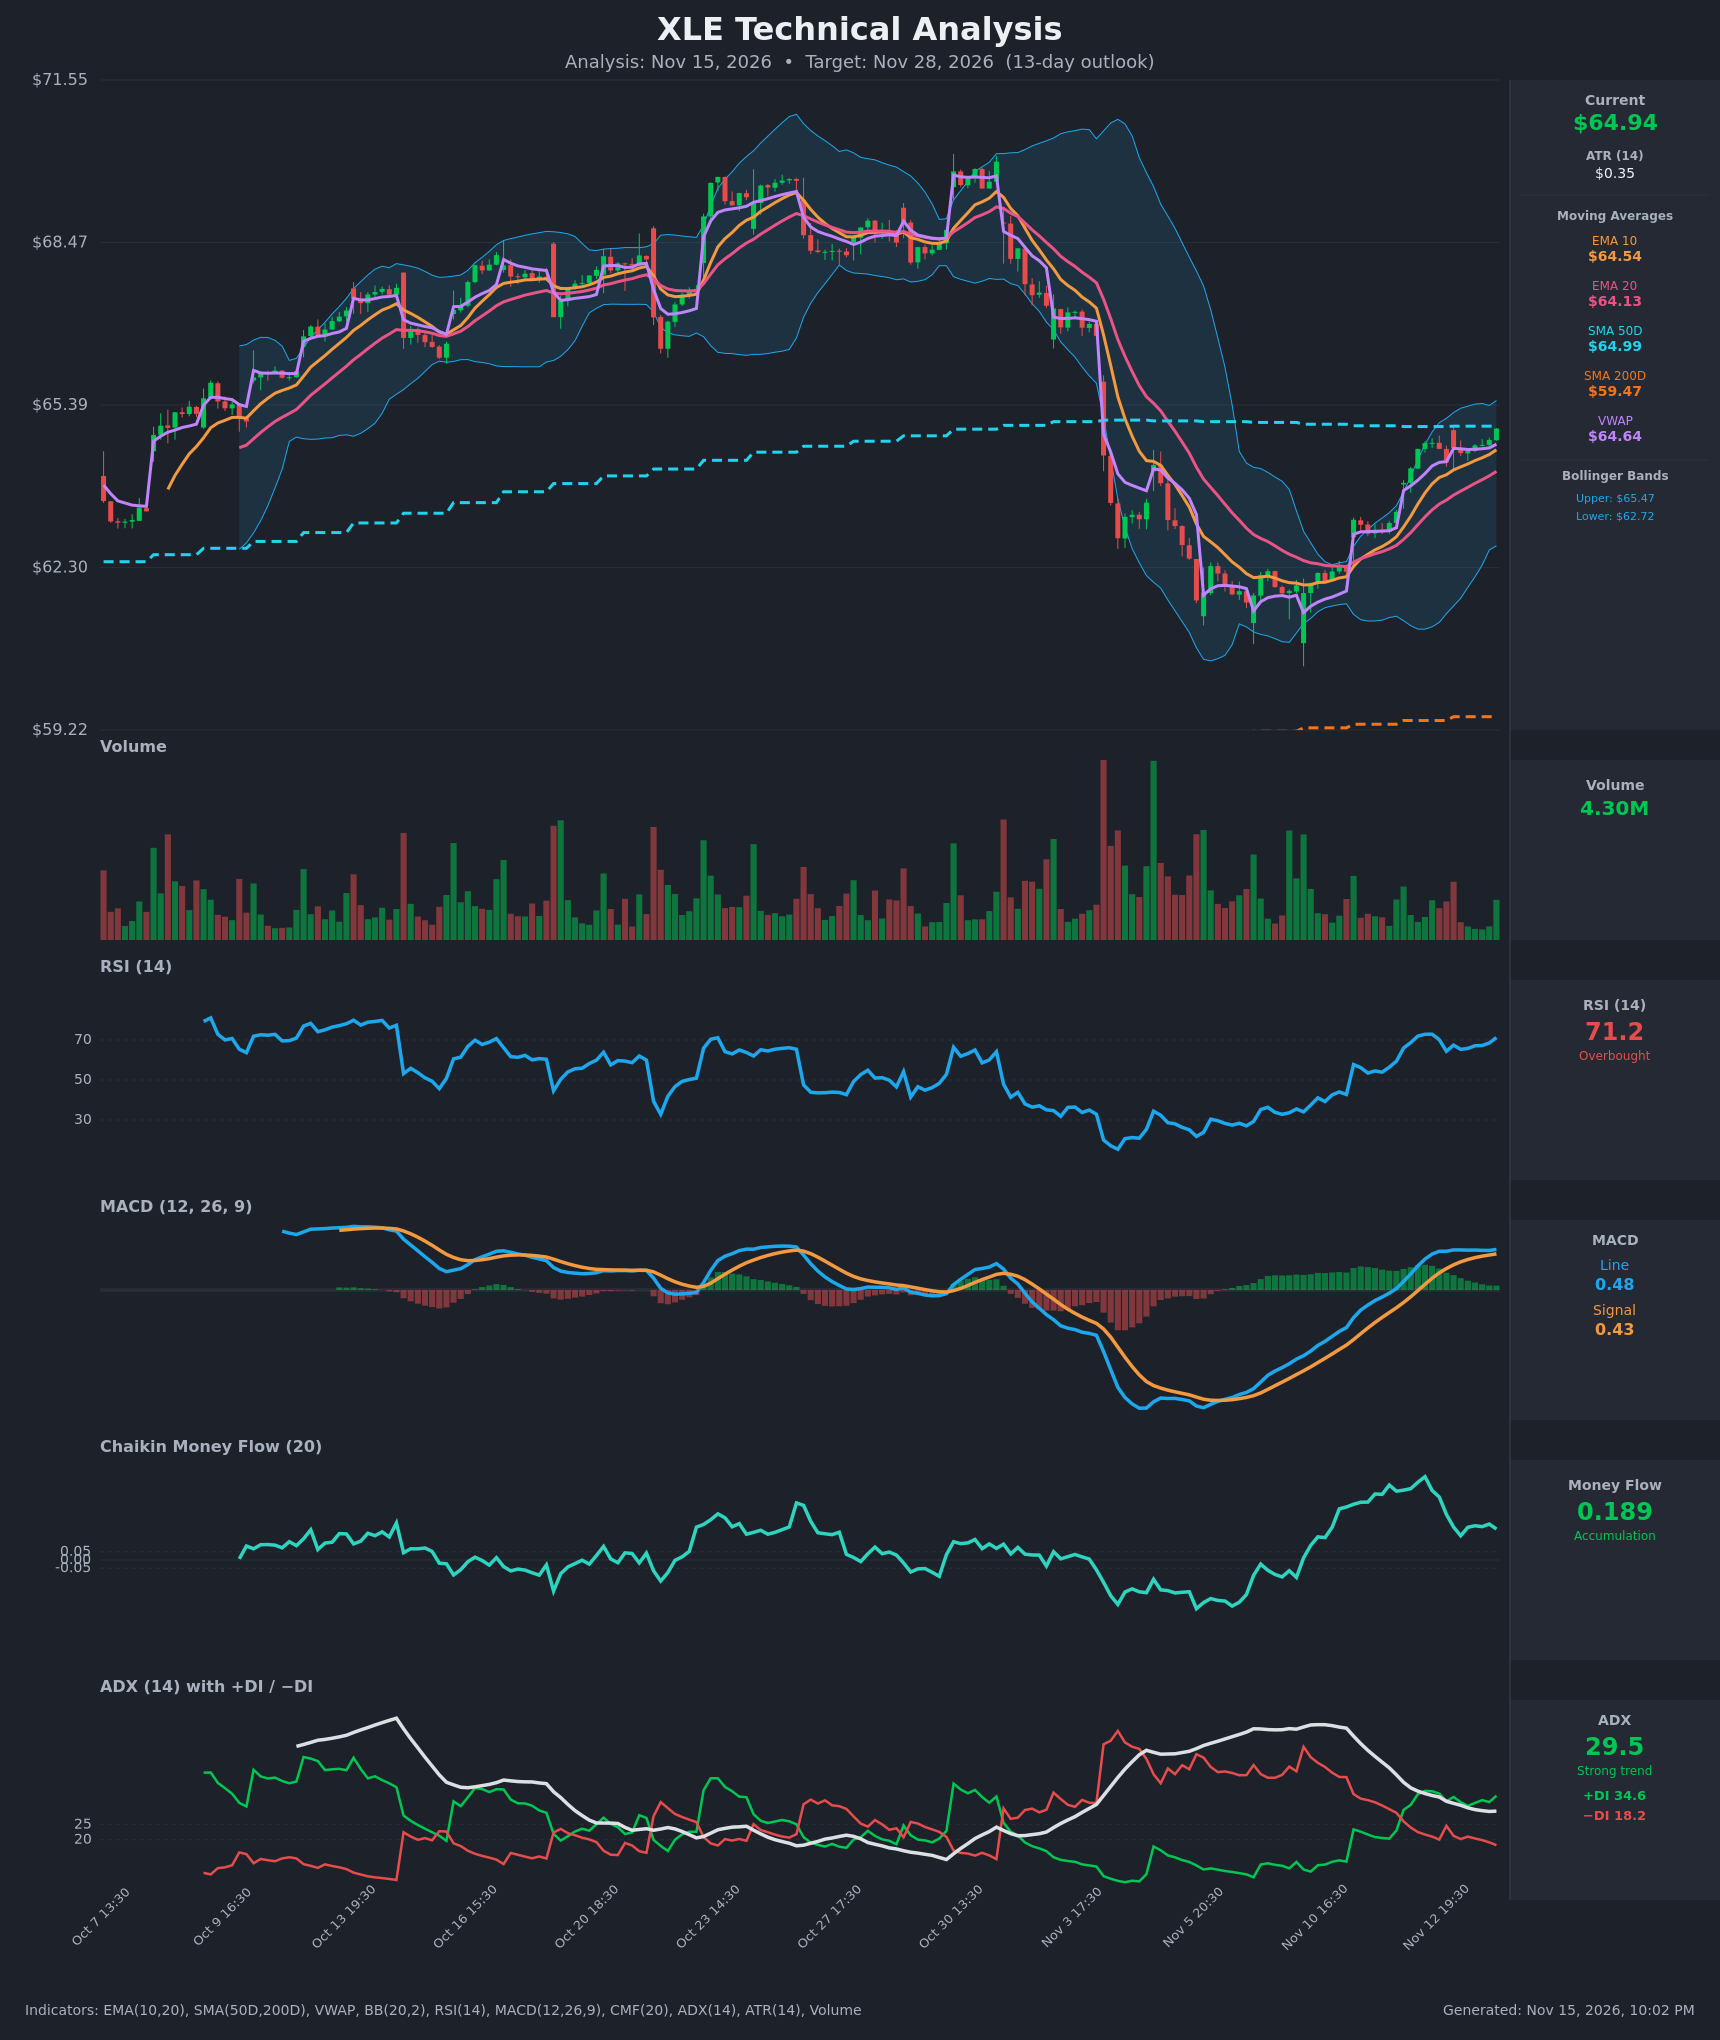
Analysis
TECHNICAL INDICATORS
- RSI (14): 71.20, just into overbought territory. It rebuilt from the mid-60s over the last several bars and is below the 72.9 peak of Nov 12. Momentum is strong, but a reading above 70 on an hourly chart often leads to a pause. [Bullish]
- 20 EMA: $64.13, with EMA10 at $64.54. Price at $64.94 is above both, and EMA10 has been above EMA20 for the whole recent window. Both slope upward, so the EMAs act as dynamic support. [Bullish]
- MACD: Line 0.481 vs signal 0.4285. The bullish crossover happened around Nov 12 16:30 to 17:30 and the line is still above the signal. The line has flattened near 0.47-0.48 while the signal catches up, so the histogram has shrunk from its peak. Momentum is positive but no longer accelerating. [Bullish]
- Bollinger Bands (20): Upper $65.47, lower $62.72. Price is in the upper quarter of the band, about $0.53 below the upper band. The bands have started to widen off the contraction after the selloff, and price is walking toward the upper band. [Bullish]
- CMF (20): 0.189, well above +0.05. It peaked at about 0.5 on Nov 12 and has settled in the 0.15-0.22 range, so buying pressure is easing but still clearly positive. [Accumulation]
- ADX (14): 29.5, with +DI 34.6 above −DI 18.2. The ADX has declined from about 41 and is flattening, which means trend strength is fading from an extreme while the direction remains up. The DI spread of about 16 points is wide, and bulls took control on Nov 12. [Strong Trend, Bullish]
- Volume: 4.30M, in line with or slightly below average on the latest bars. The rebound from the lows came on solid green volume bars, but volume on the latest push toward $65 is not expanding. A breakout above $65 would need volume confirmation. [Neutral to mildly Bullish]
DIVERGENCES & TRENDS
- MACD/RSI divergence: There is no clear bearish divergence yet. RSI peaked at 72.9 on Nov 12 and is now 71.2 with price at a slightly higher close ($64.94 vs $64.67). That is a mild, early momentum non-confirmation, not a divergence.
- Trend: The EMA10/EMA20 stack is bullish and the MACD crossover is confirmed. Price is also well above the SMA200D ($59.47), so the long-term uptrend is intact.
- SMA50 test: Price is sitting at the SMA50D ($64.99), a flat line that has capped the rebound. The SMA50 is about 9% above the SMA200, so there is no golden or death cross. A close above it is the key break to watch.
- VWAP: Price is above VWAP ($64.64), which supports buyers.
- Fading strength: ADX is declining from 41 and CMF is off its highs. The trend is still bullish but maturing after a sharp V-shaped recovery of about 4 points off the $61 low.
- Fibonacci retracement: The move from about $69 down to about $61.2 has been retraced roughly 47%. The 50% level is near $65.1 and the 61.8% level is near $66.0, so overhead supply sits in the $65.1-$66.0 zone.
CHART PATTERNS
- Bullish Double Bottom (small base): The lows near $61 on Nov 6-10 formed a base. Price then broke the neckline around $62.3-$62.5, and the measured move (~$63.6) has already been achieved. The pattern is done, and any further upside is a continuation of the rebound.
- Bullish Flag/Pennant (tentative): The tight grind in the $64.3-$64.9 range over the last day looks like a brief consolidation under the SMA50. A breakout above $65.0-$65.5 would project toward about $66.0-$66.5, adding the pole height of roughly $2.5 to the breakout level.
- Resistance zone: Price is pressing into the SMA50, the upper Bollinger Band and the 50% retracement. Failure here would turn this into a corrective bounce inside the larger decline from $69.
POTENTIAL SCENARIOS
- Scenario 1: Bullish SMA50 Breakout and Continuation — Price clears the SMA50 and upper Bollinger Band on a hourly close, with EMA10/20 and VWAP holding as support and +DI staying dominant. Upside extends toward the 61.8% retracement. Trigger: a close above $65.50 with volume above 5M. Target: $66.00-$66.80. Invalidation: a close back below $64.13 (EMA20). (50% probability)
- Scenario 2: Bearish Overbought Rejection and Pullback — RSI above 70, resistance at the SMA50/50% retracement and a shrinking MACD histogram trigger profit-taking. Price retraces to the EMAs and the band midline. Trigger: a rejection at $65.0-$65.5 and a MACD bearish crossover. Target: $63.50-$64.10. Invalidation: a close above $65.60. (35% probability)
- Scenario 3: Neutral Consolidation — Price chops between $64.10 and $65.50 as ADX continues to cool and the moving averages catch up. Trigger: repeated hourly closes inside the range with lower volume. Target: $64.50-$65.20. Invalidation: a break above $65.60 or below $64.00. (15% probability)
PRICE TARGETS
- Target Price: $65.70 (13-day)
- Expected Range: $62.90 to $67.60. This is $4.70 wide, or about 7.2% of the current price, which is between the 7-10 day and 14-21 day guidance and appropriate for 13 days. ATR of $0.35 supports roughly a $1.3 daily-noise band over multiple sessions.
- Key Levels: Support at $64.13 (EMA20), Resistance at $65.47 (upper Bollinger Band, with the SMA50 at $64.99 just ahead and the 61.8% retracement near $66.00)
OVERALL BIAS
OVERALL BIAS: BULLISH - A confirmed MACD bullish crossover, price above all short-term EMAs, VWAP and the SMA200D, strong CMF accumulation, and +DI dominance outweigh the overbought RSI and SMA50 resistance. Conviction is modest because momentum is fading near $65, so a pullback to the EMAs is plausible before the next leg up.
This is educational analysis and not financial advice.