SPY 2-day bullish forecast — Oct 29, 2026
- Bias: Bullish
- Timeframe: 2 days (made Oct 29, 2026, target date Oct 30, 2026)
- Price at analysis: $769.49
- Price target: $771.50
- Expected range: $762.00 – $777.50
- Result: Incorrect (-1.8%) — closed at $755.72 on Oct 30, 2026; quality score 31/100
Get a free AI analysis of SPY today
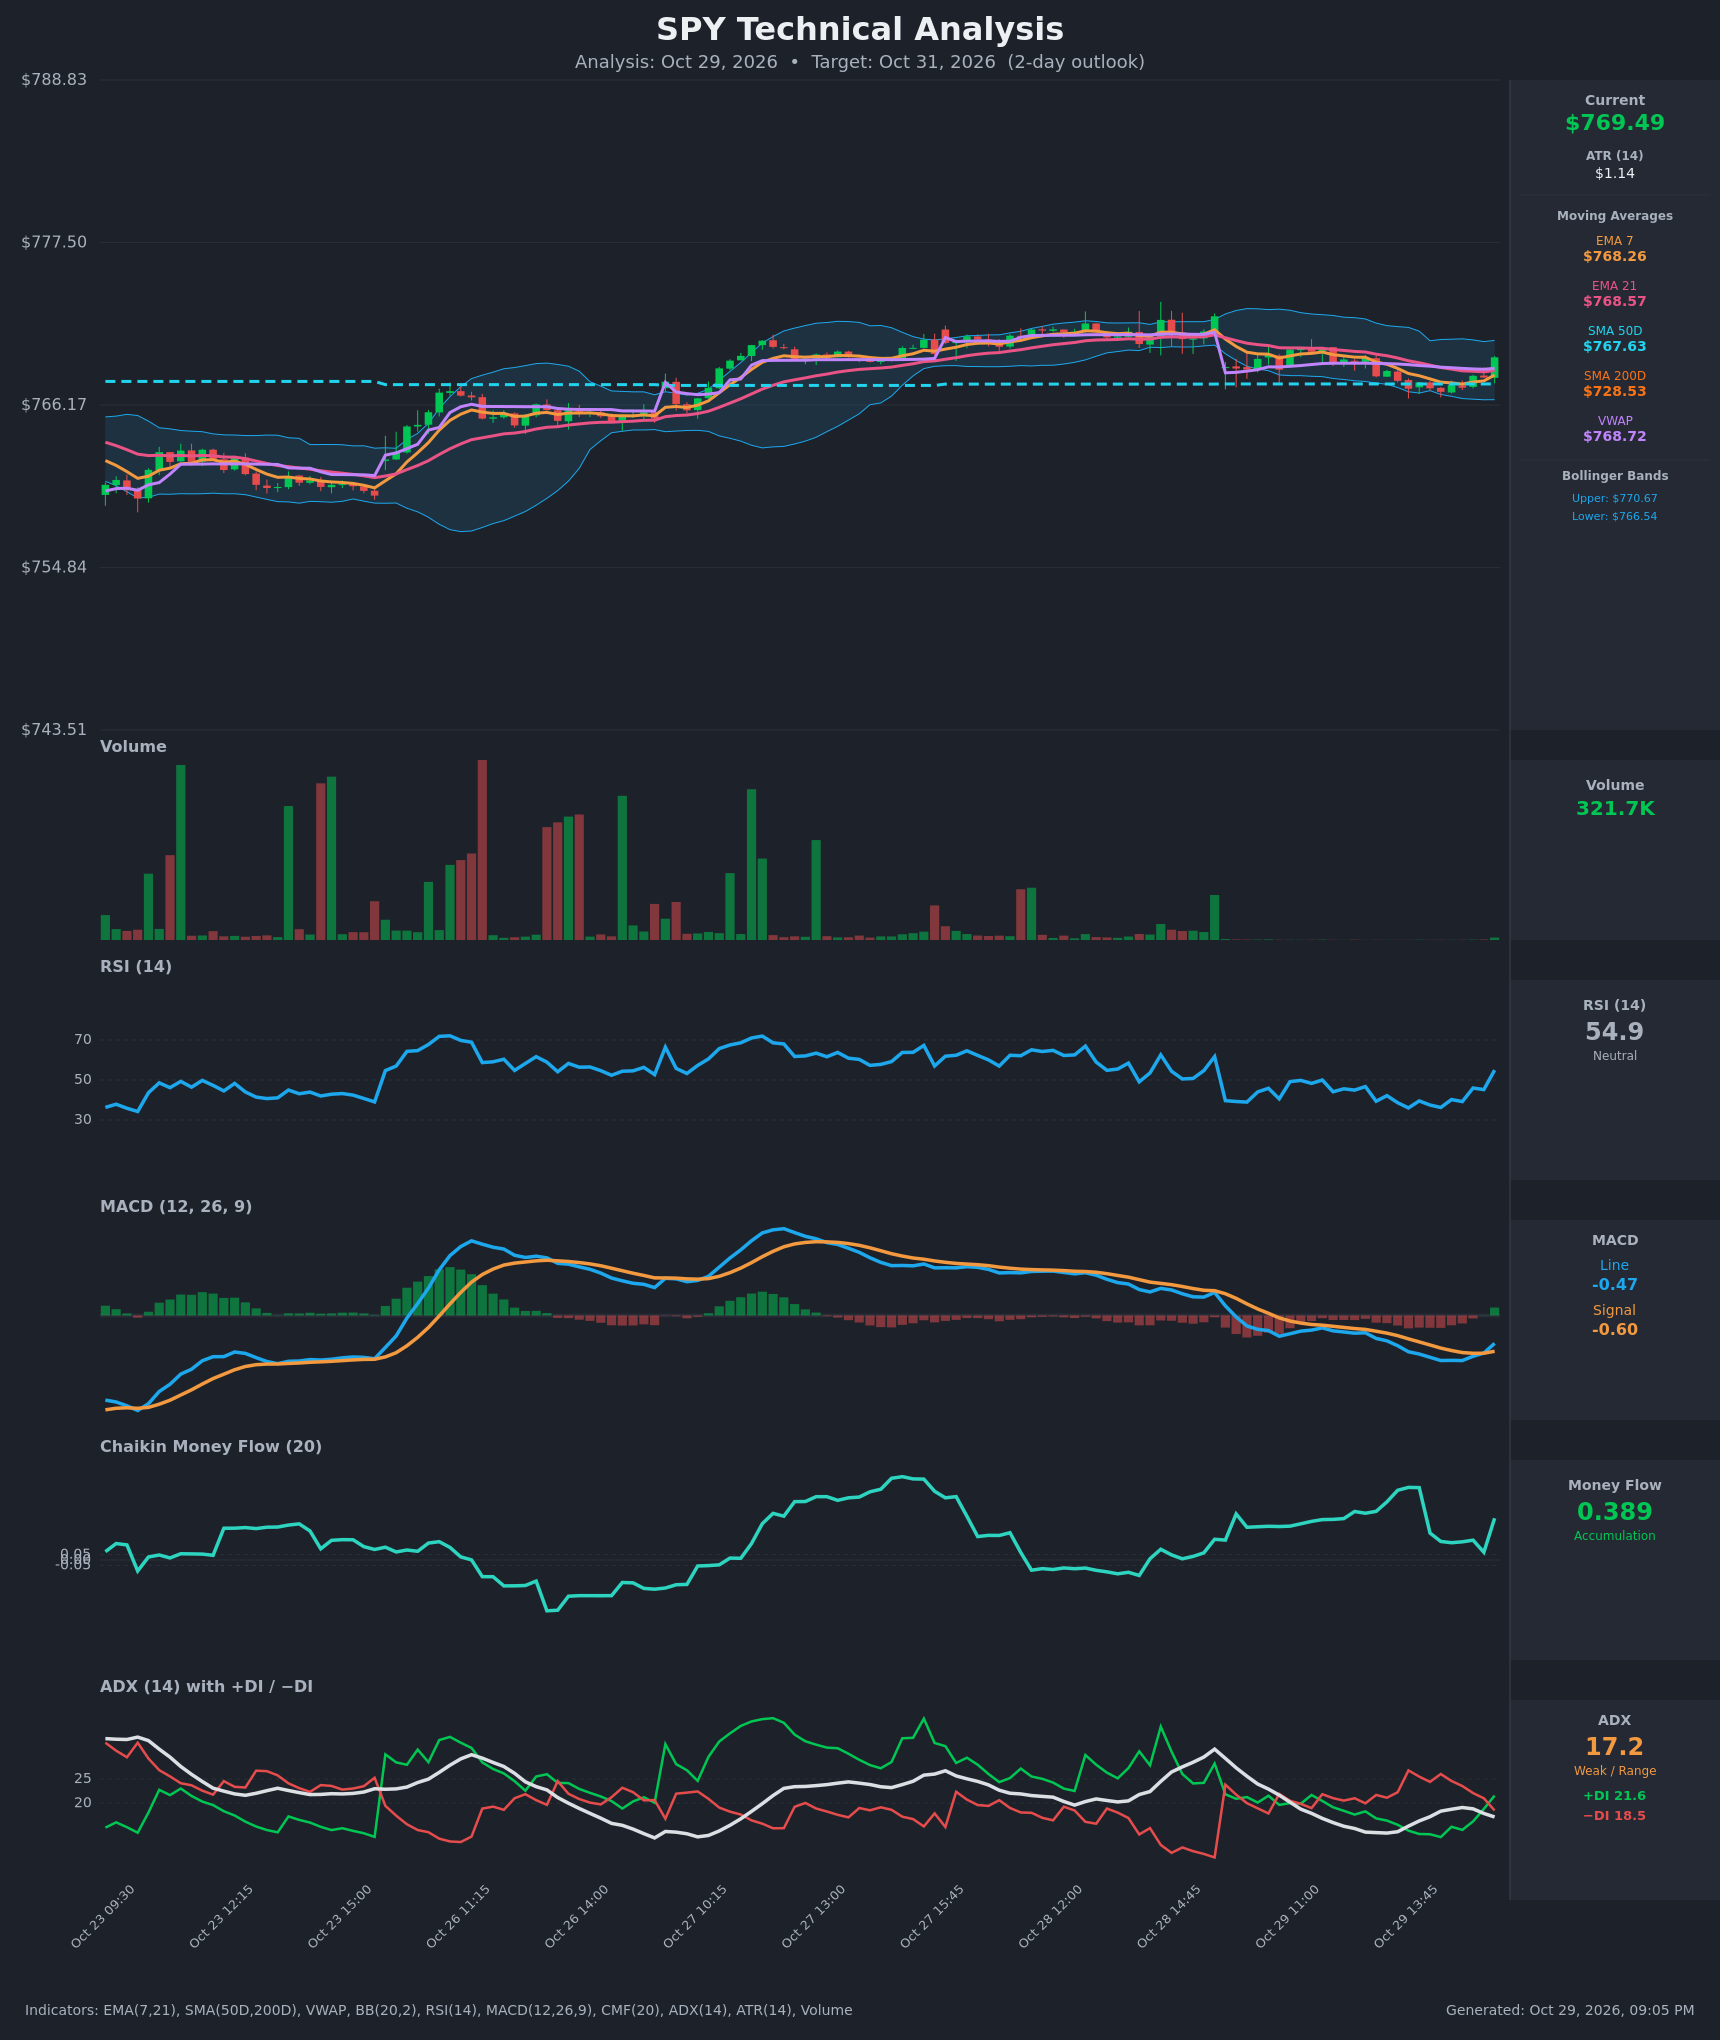
Analysis
TECHNICAL INDICATORS
- RSI (14): 54.94, up sharply from the 36-40 zone over the last few hours (39 → 46 → 55). It has crossed back above 50 with rising momentum and is not overbought. [Bullish]
- 20 EMA: EMA 7 is $768.26 and EMA 21 is $768.57. Price at $769.49 is above both, so they act as support. EMA 7 is still slightly below EMA 21, so the bearish cross has not yet reversed, but the gap has narrowed to about $0.31. [Bullish]
- MACD: The line at -0.471 has just crossed above the signal at -0.604, and the histogram flipped from negative to positive (+0.13). The cross is bullish but happens below zero, so it is a recovery signal rather than a trend-confirming one. [Bullish]
- Bollinger Bands (20): Upper $770.67, lower $766.54, midline about $768.60. The bands are narrow (about $4.1 wide), a squeeze after the Oct 28 drop. Price sits above the midline in the upper half, which favors an upside test of the upper band. [Bullish]
- CMF (20): 0.389, well above +0.05 and positive throughout the recent session. It dipped to 0.07 and rebounded, which points to persistent accumulation. [Accumulation]
- ADX (14): 17.2 and falling, so the trend is weak and the market is range-bound. +DI (21.6) just crossed above −DI (18.5), a tentative shift to bull control. [Weak Trend, bullish lean]
- Volume: 321.7K on the latest bar, light overall. The last bar is a large green candle that closed at the session high. Volume is thin compared with the Oct 23-27 spikes, so breakout confirmation is limited. [Neutral to mildly bullish]
DIVERGENCES & TRENDS
- There is no clear divergence. RSI and MACD turned up together with price, and CMF is high and rising.
- CMF is much stronger than price action, since price has drifted sideways to lower since Oct 28. This favors a resolution higher.
- The MACD bullish cross and the +DI/−DI cross happened on the same bar as the move above EMA 7, EMA 21 and VWAP ($768.73). This gives a cluster of short-term bullish signals.
- EMA 7 remains below EMA 21, and the MACD is still below zero, so the larger trend since Oct 28 is sideways to down.
- Price is far above SMA 200 ($728.53) and above SMA 50 ($767.63), so the long-term uptrend is intact. A golden cross is already in place.
- ADX is below 20 and fading, which suggests chop rather than a strong move.
CHART PATTERNS
- Since the Oct 28 gap down, price has held a tight range around $767-$769.5 with lower highs and a squeezing Bollinger Band. This resembles a Bullish Flag / Pennant or a loose Falling Wedge after the drop. The pattern is not confirmed.
- A close above $770.67 (the upper band) would signal a breakout. The measured move targets the $772-$773 area, near the Oct 28 highs.
- This is a weak-conviction pattern. A failure below $767.63 / $766.54 would turn it into a range break, with a drift toward $764-$765.
POTENTIAL SCENARIOS
- Scenario 1: Bullish Squeeze Breakout — The MACD cross, +DI cross, strong CMF and price above the EMAs and VWAP extend into a breakout of the compression range. Trigger: sustained move above $770.67. Target: $772.50-$773.50. Invalidation: close back below $767.60. (50% probability)
- Scenario 2: Neutral Range Chop — Weak ADX keeps price between the SMA 50 and the upper band. Trigger: failure at $770.67 with low volume. Target: $767.50-$770.50. Invalidation: a break outside $766.50-$771.00. (30% probability)
- Scenario 3: Bearish Failed Bounce — The latest rally fades into the EMA 21 / upper band, and the MACD rolls over below zero. Trigger: loss of $767.63 (SMA 50). Target: $764.00-$765.00. Invalidation: reclaim of $769.50 with volume. (20% probability)
PRICE TARGETS
- Target Price: $771.50 (2-day, Oct 31)
- Expected Range: $762.00 to $777.50 (width $15.50, about 2.0% of price, within the 2-4% guideline for 2-3 days)
- Key Levels: Support at $767.63 (SMA 50, with the lower Bollinger Band at $766.54 below it), Resistance at $770.67 (upper Bollinger Band; the next resistance is about $773)
OVERALL BIAS
OVERALL BIAS: BULLISH - The MACD bullish cross, the +DI/−DI cross, RSI back above 50, strong CMF accumulation (0.389), and price above the EMAs, VWAP and SMA 50 within a squeezing range favor an upside break. The weak ADX (17.2) limits conviction.
This is educational analysis and not financial advice.