SPY 62-day bearish forecast — Nov 15, 2026
- Bias: Bearish
- Timeframe: 62 days (made Nov 15, 2026, target date Jan 15, 2027)
- Price at analysis: $754.37
- Price target: $741.00
- Expected range: $680.00 – $818.00
- Result: Pending — graded after the close on Jan 15, 2027
Get a free AI analysis of SPY today
Analysis
TECHNICAL INDICATORS
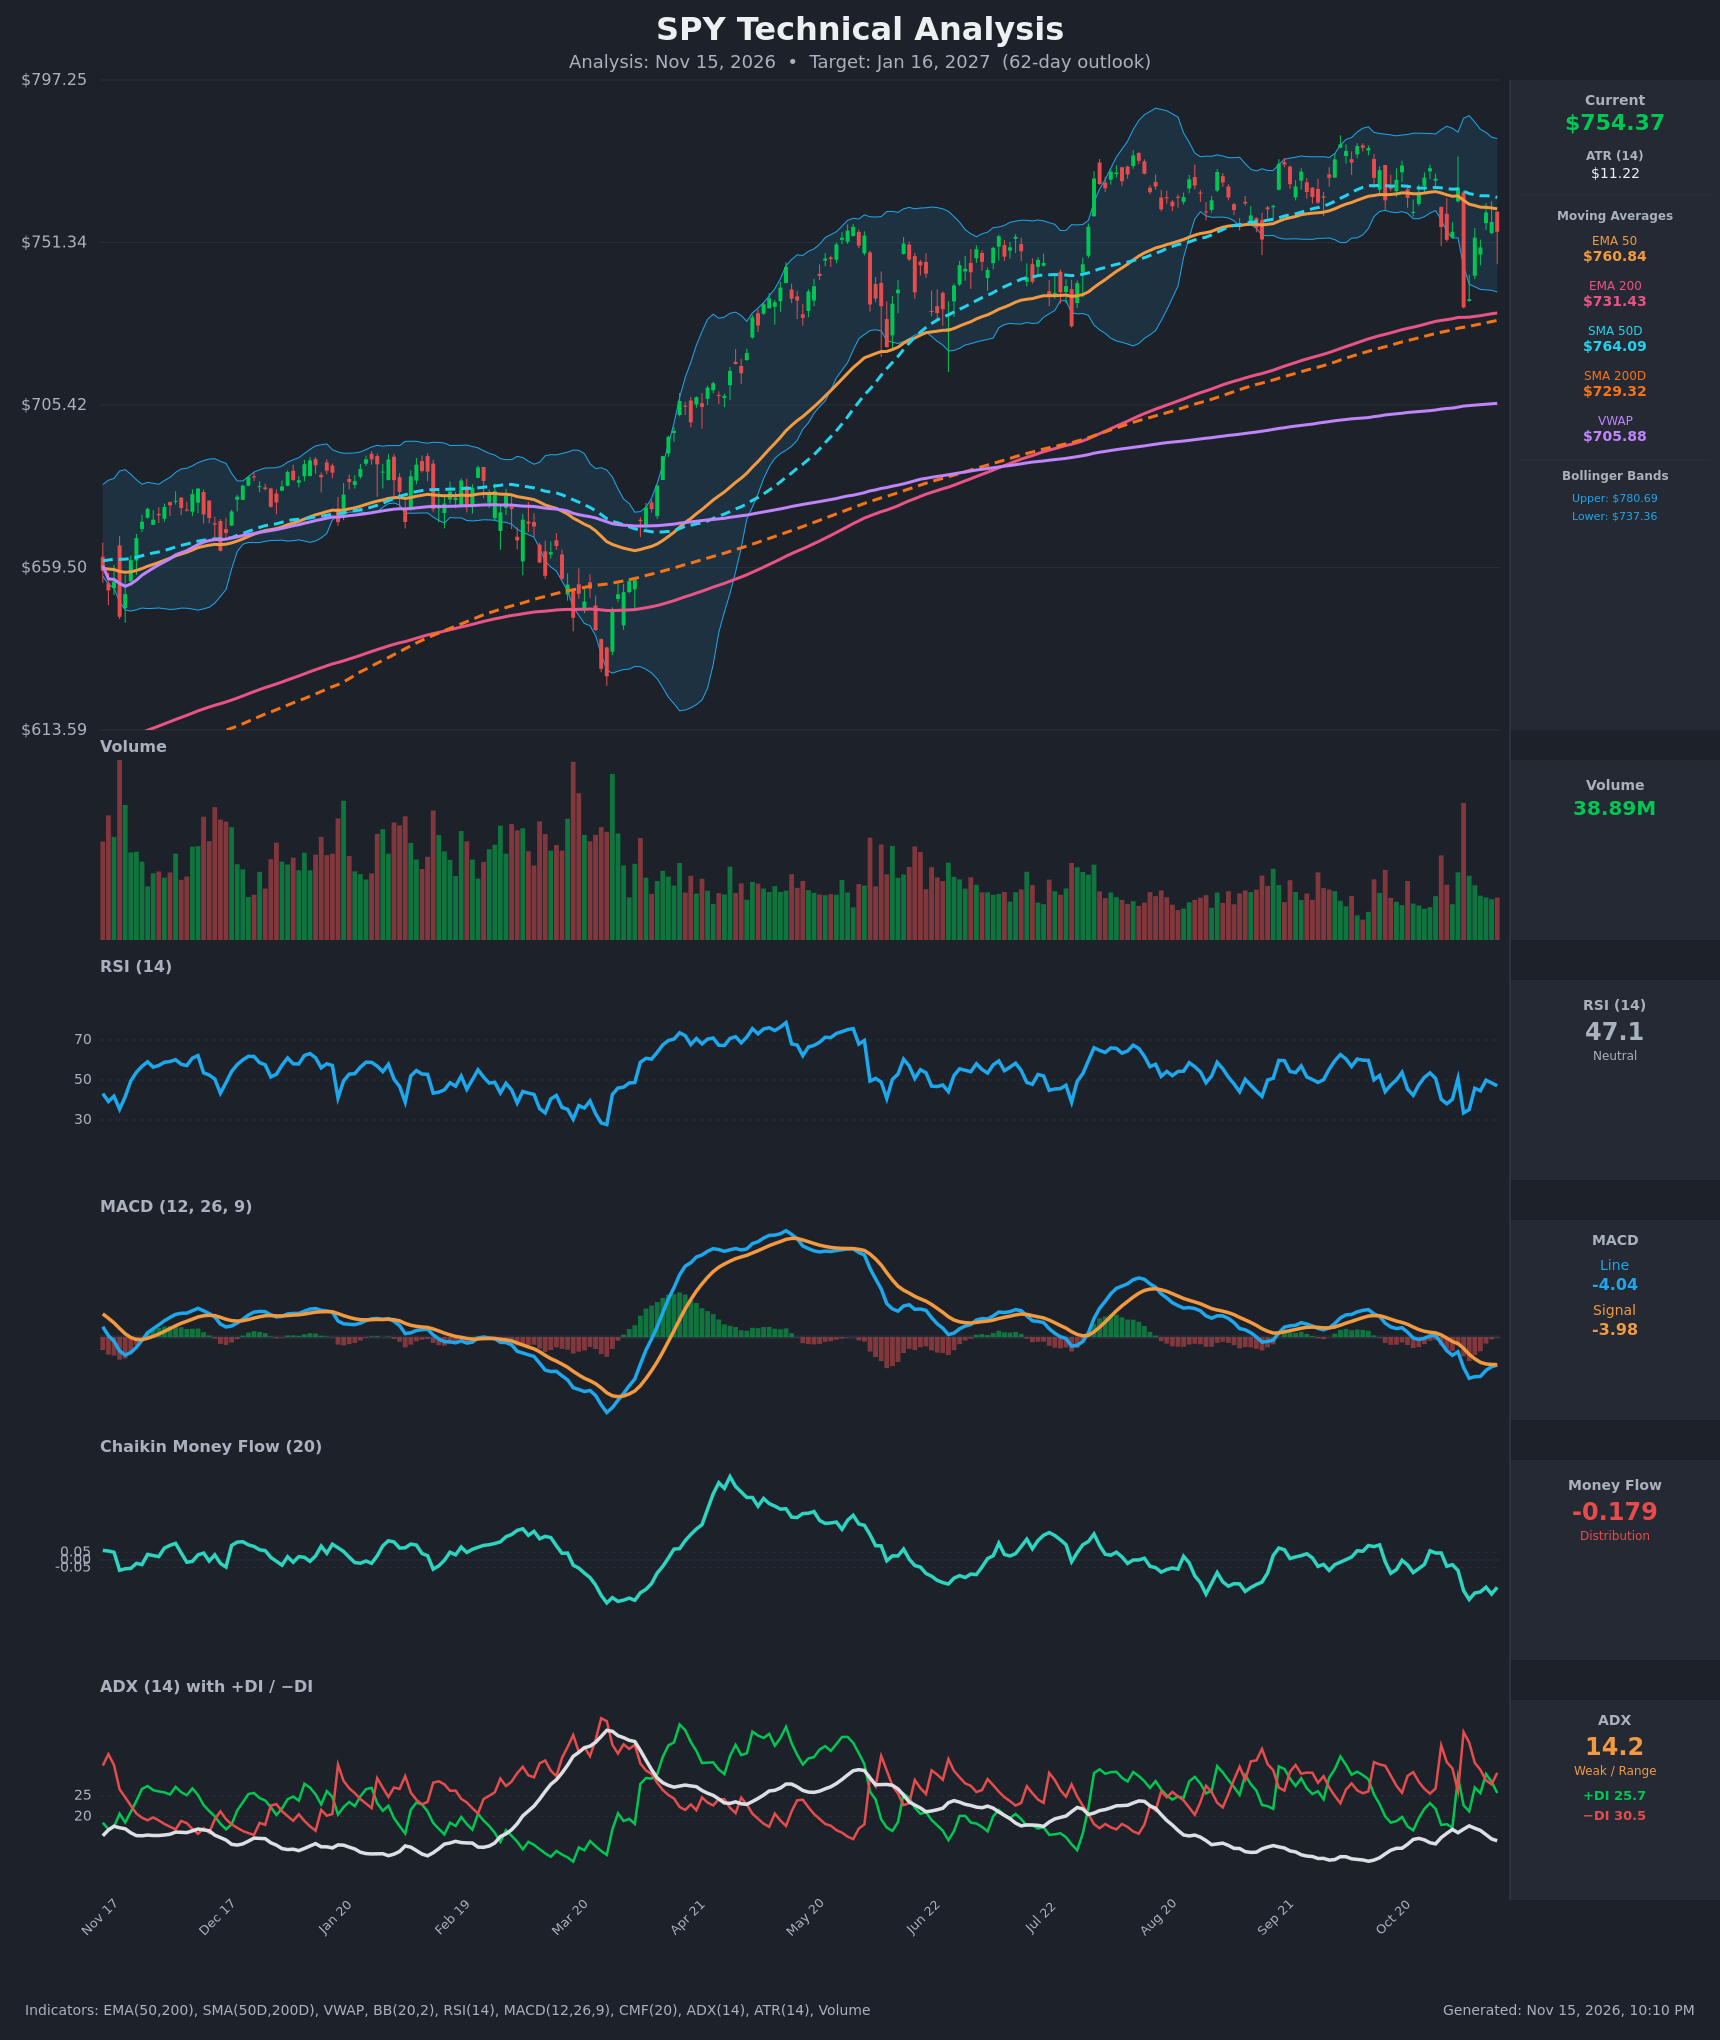
- RSI (14): 47.14, just under the 50 midline. It has swung between 33.6 (Nov 5) and 51 over the last two weeks and is not oversold, so there is room to fall further. Momentum is flat to slightly weak. [Neutral]
- 20 EMA: The 20 EMA is not supplied. The nearest proxy is the 20-period Bollinger midline, about $759.02. Price at $754.37 is below it, as it is below the EMA 50 ($760.84) and SMA 50D ($764.09). Price has failed to hold above these short-term averages since Oct 30. [Bearish]
- MACD: Line -4.044 versus signal -3.980, so the line is just below the signal and the histogram is about -0.06. Both lines are well below zero. The line bounced from -5.96 toward the signal but is turning back down without crossing, a sign that the bounce is stalling. [Bearish]
- Bollinger Bands (20): Upper $780.69, lower $737.36, midline about $759. Price sits in the lower half of the bands, about 1.2 ATR above the lower band. Band width is moderate (~5.7%) after the Nov 5 volatility spike. Nothing is oversold, and a break of the lower band would signal acceleration. [Neutral]
- CMF (20): -0.179, well below -0.05 and near the lowest level in the visible chart. It is down from near zero in late October, which shows persistent distribution and selling into rallies. [Distribution]
- ADX (14): 14.2, so there is no strong trend and the market is range-bound. −DI (30.5) is above +DI (25.7), so sellers hold a modest edge, but the low ADX limits conviction. [Weak Trend, bearish tilt]
- Volume: 38.89M, which is average to slightly below average. The heaviest recent volume came on the red Nov 5 selloff (-4.4%, $766.81 to $733.00), while the rebounds came on lighter volume. That is a mild sign of distribution. [Mildly Bearish]
DIVERGENCES & TRENDS
- Long-term structure: Price is above both the SMA 200D ($729.32) and EMA 200 ($731.43). The golden cross (SMA50D $764.09 over SMA200D) and EMA50 over EMA200 are intact, and the 200-day averages are still rising. The primary trend is up.
- Short-term structure: Price is below the EMA 50, SMA 50D and the Bollinger midline. The EMA 50 is falling steadily ($765.72 to $760.84), and the gap between the 50s and 200s is narrowing (SMA spread about 42 to 35 points). That is early trend deterioration, not a death cross.
- Momentum: MACD has been below its signal since Nov 2 and is flattening just beneath it. RSI made a lower high (about 50-51) on the Nov 11 bounce, below the 53.5 of Oct 28.
- Money flow: CMF is falling while price holds near $750-760, so money flow is weaker than price. This is a bearish divergence.
- Directional movement: −DI has been above +DI on 14 of the last 15 bars, with only a brief flip around Nov 4.
- VWAP: Price is well above VWAP ($705.88), so the longer-term buyer cost basis is far below. This supports dip-buying near the 200-day averages.
CHART PATTERNS
- Triple Top / rectangle (Bearish Triple Top reference): SPY has repeatedly stalled at roughly $770-780 since July (peaks in Aug-Oct) and has support near $733-740. That is a broad range of about $733 to $780 with weak ADX. A close below $733 would confirm a range breakdown. The measured move is about -$45, or roughly $688.
- Sell-off, rebound, lower high: The Nov 5 gap-down was followed by a rebound that is stalling under the EMA 50. This resembles a bearish pennant or flag, but it is loosely formed.
- Support for bulls: The rising 200-day averages at $729-731 sit right under the Nov 5 low. A hold there keeps the range intact, with $780 as the upside objective.
POTENTIAL SCENARIOS
- Scenario 1: Bearish Range Breakdown / Test of the 200s — Distribution (CMF -0.18) and a −DI lead keep price capped under the EMA 50 and SMA 50D. Price drifts lower, retests the Nov 5 low and the 200-day zone, and possibly overshoots. Trigger: close below $733 with MACD pushing back toward -6. Target: $715-$740, with an extension toward $688 on a clean break. Invalidation: daily close above $765 (SMA 50D) with CMF back above 0. (45% probability)
- Scenario 2: Bullish Range Recovery — The long-term uptrend asserts itself. Buyers defend the 200-day zone, price reclaims the EMA 50 and SMA 50D, and a MACD bullish cross sends it back toward the upper Bollinger Band and the prior highs. Trigger: close above $765 on rising volume. Target: $780-$800. Invalidation: close below $731 (EMA 200). (35% probability)
- Scenario 3: Neutral Chop — ADX stays below 20 and price oscillates between $735 and $775 with no resolution. Trigger: repeated failures at both $760 and $735. Target: $745-$765. Invalidation: a decisive close outside $733-$780. (20% probability)
PRICE TARGETS
For the 62-day horizon (to about Jan 16, 2027):
- Target Price: $741.00
- Expected Range: $680.00 to $818.00 (width $138, about 18.3% of current price, in line with the 61-180 day guidance)
- Key Levels: Support at $733.00 (Nov 5 swing low, just above the 200-day averages at $729-$731), Resistance at $760.84 (EMA 50, then SMA 50D at $764.09)
OVERALL BIAS
OVERALL BIAS: BEARISH - Short-term evidence outweighs the bullish side: price is below the EMA 50 and SMA 50D, MACD is below its signal, CMF shows heavy distribution (-0.179), and −DI leads +DI. The rising 200-day averages near $730 limit the downside, so conviction is modest and the bias is a mild pullback toward the $735-$740 zone.
This is educational analysis and not financial advice.