SPY 2-day bearish forecast — Nov 18, 2026
- Bias: Bearish
- Timeframe: 2 days (made Nov 18, 2026, target date Nov 19, 2026)
- Price at analysis: $730.33
- Price target: $727.80
- Expected range: $714.00 – $743.00
- Result: Pending — graded after the close on Nov 19, 2026
Get a free AI analysis of SPY today
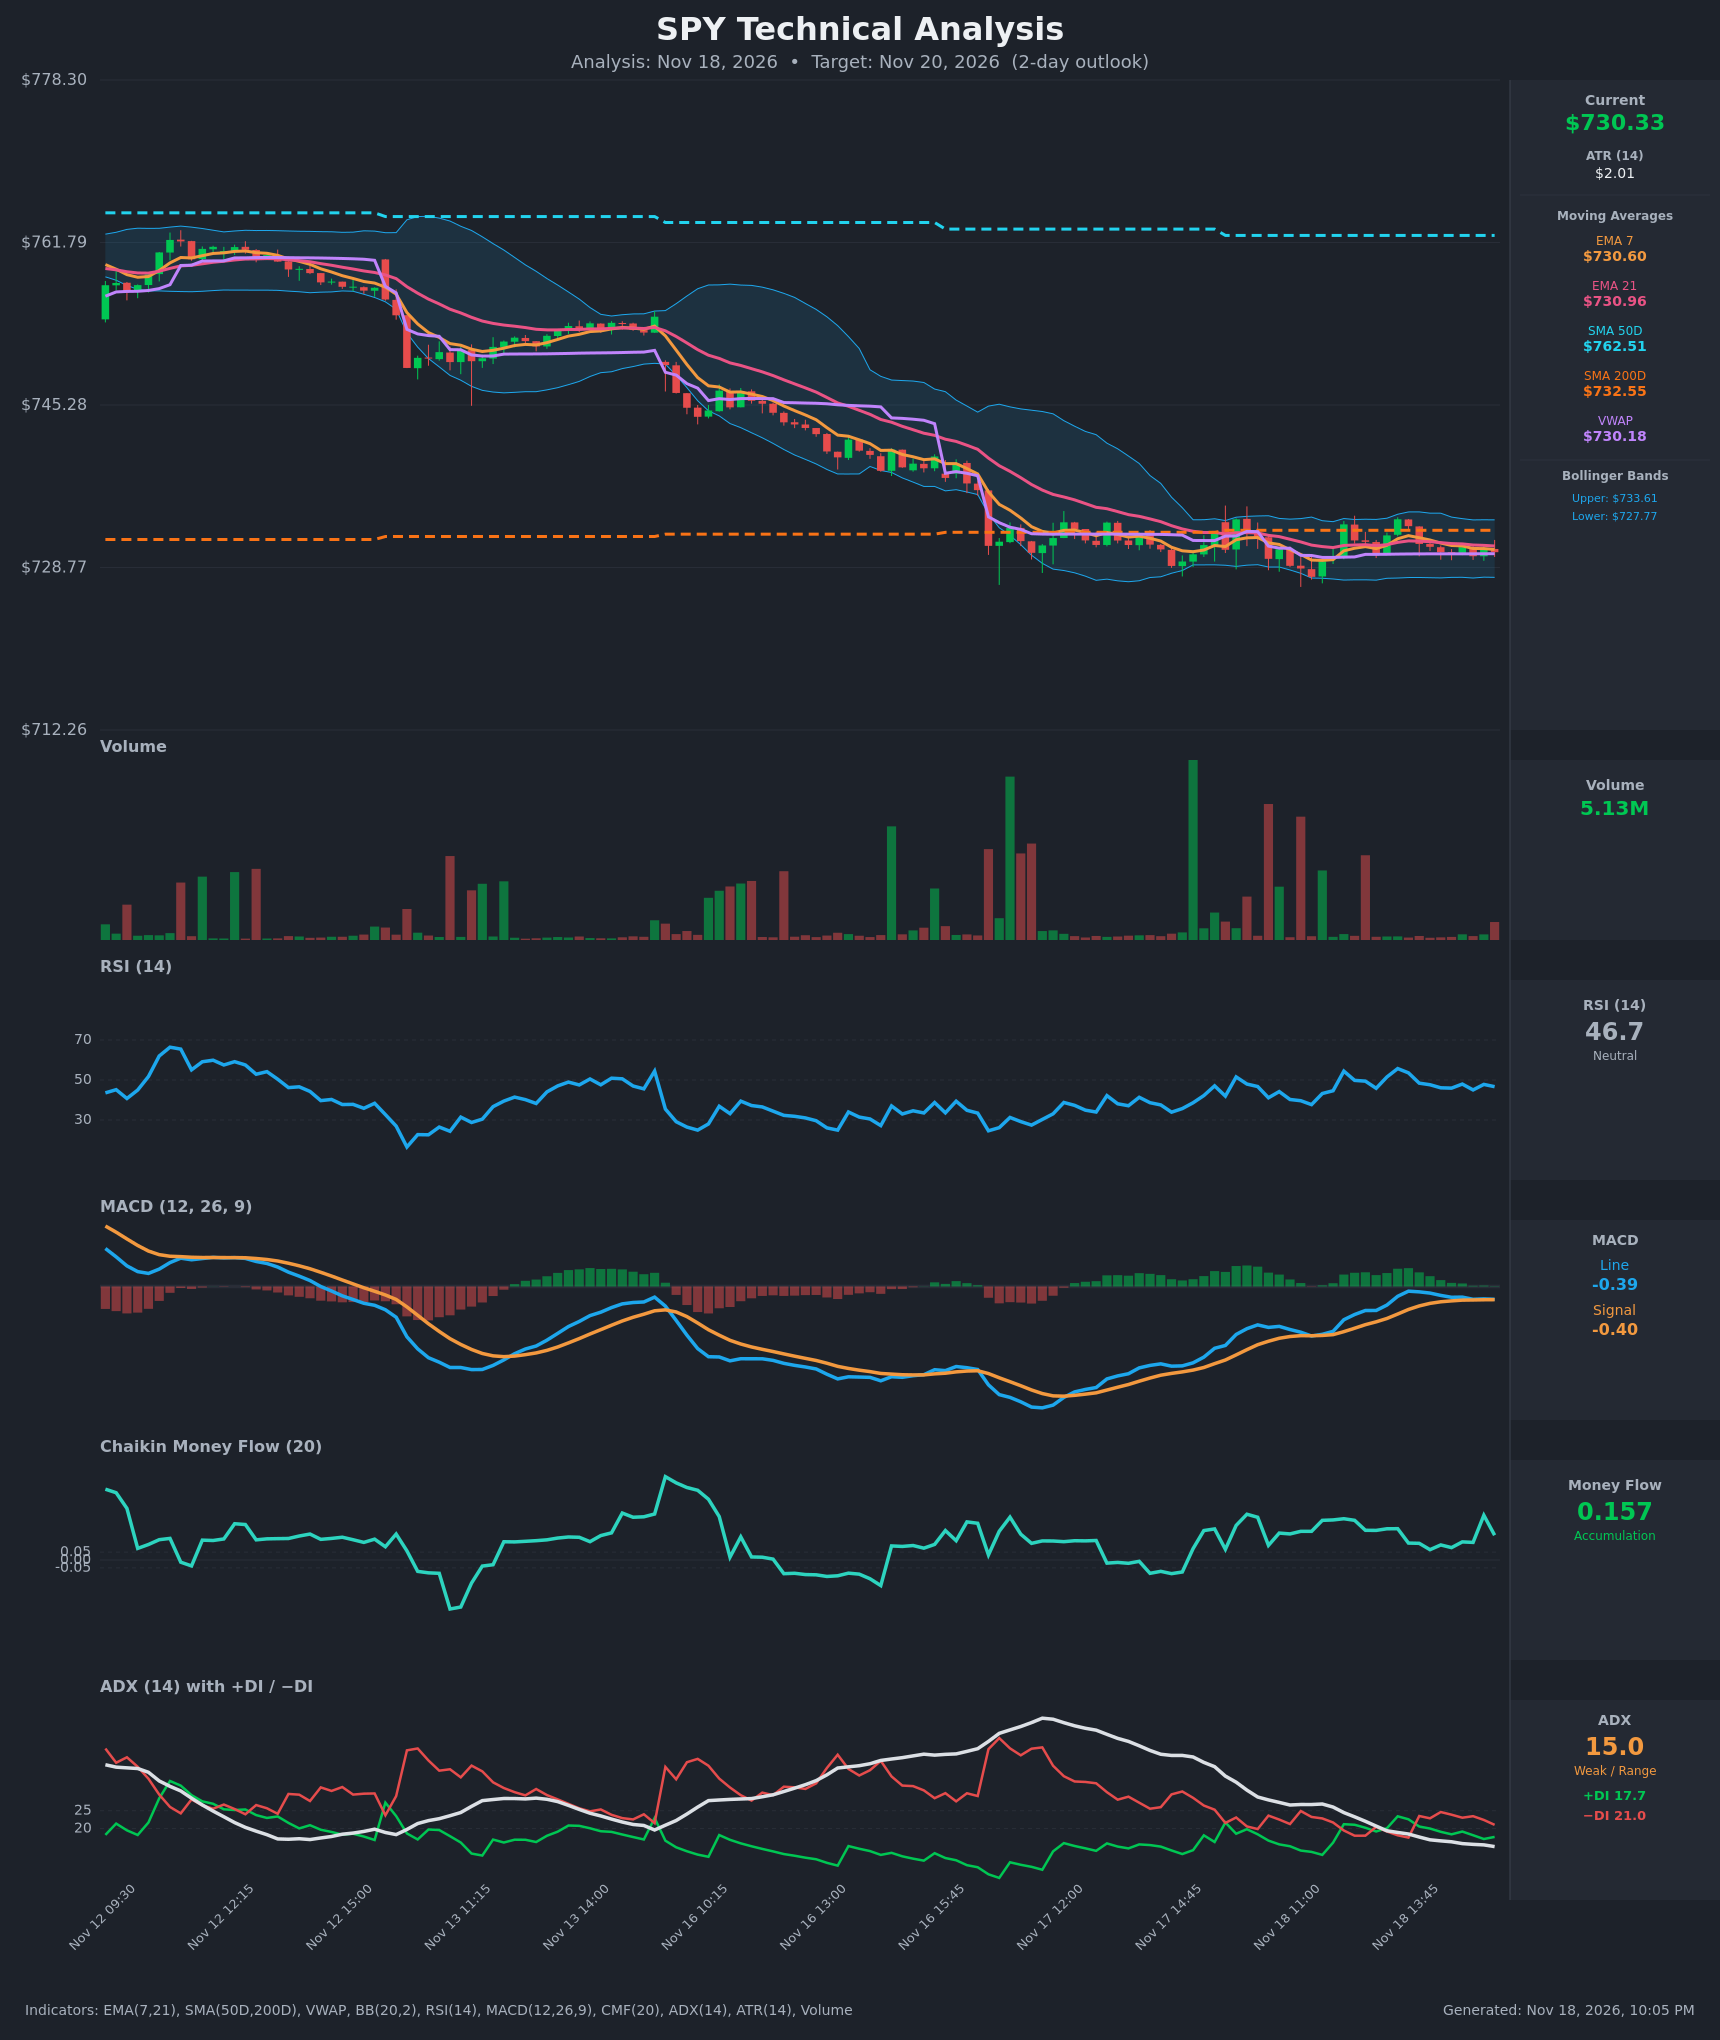
Analysis
TECHNICAL INDICATORS
- RSI (14): 46.66, just under the 50 midline and well away from the 30/70 extremes. It has chopped between 45 and 55 over the last 15 bars with no clear direction. Slightly soft momentum. [Neutral]
- Moving Averages: Price ($730.33) is below EMA 7 ($730.60) and EMA 21 ($730.96), both acting as minor resistance. EMA 7 is below EMA 21, a mild bearish stack that has held since about Nov 18 14:30. Price is below SMA 200D ($732.55), which is overhead resistance, and far below SMA 50D ($762.51). SMA 50D sits well above SMA 200D, so there is no death-cross signal. VWAP ($730.18) is just under price and acts as the nearest support. Overall, price is stuck under a cluster of resistance, and the long-term trend of lower highs from $762 is still intact. [Bearish]
- MACD: Line -0.39 and signal -0.40, so the histogram is almost flat (about +0.01). The line has just converged with the signal after a bullish cross earlier in the day, and both are slightly below zero. The two are rolling over together, which shows momentum fading rather than building. [Neutral]
- Bollinger Bands (20): Upper $733.61, lower $727.77, middle about $730.69. Price is in the middle of a narrow band, which has contracted sharply from the wide bands of the earlier selloff. This points to a volatility squeeze and a pending expansion with no directional edge yet. [Neutral]
- CMF (20): 0.157, above the +0.05 threshold and positive across the entire 15-bar window (0.07 to 0.28). There is steady buying pressure inside the range despite flat price. [Accumulation]
- ADX (14): 15.0 and falling from 24.5, so the trend is weak and range-bound. −DI (21.0) is above +DI (17.7), a modest bearish tilt that has held since Nov 18 14:00. [Weak Trend, bearish lean]
- Volume: 5.13M on the latest bar, a modest uptick after a long stretch of thin bars. Volume has been light during the sideways drift and heavy only on the earlier selloff legs and a few spikes. There is no breakout confirmation yet. [Neutral / drying up]
DIVERGENCES & TRENDS
- CMF divergence: CMF is positive (+0.157) while price is flat to slightly lower, a mild bullish divergence. Accumulation is showing up inside the range but has not lifted price.
- Trend: The larger trend is a stair-step decline from about $762 to $730. The last stretch is a tight sideways base around $727-$734.
- ADX decay: ADX has fallen from above 30 to 15, so the selloff has lost its momentum. This is typically a pause before the next directional move.
- MACD: It crossed up through its signal earlier but has now converged back to it. The bullish momentum burst has faded, and a bearish re-cross would be a negative.
- EMA and DI tilt: EMA 7 is below EMA 21 and −DI is above +DI. The short-term lean is slightly bearish, with no decisive crossover.
- Overhead cap: SMA 200D at $732.55 is just above price. It has capped bounces and sits close to the upper Bollinger Band.
CHART PATTERNS
- Bearish Rectangle / Bearish Flag-type consolidation: After the steep decline, price has formed a horizontal base between about $727 and $734. This is a continuation pattern, and the break is usually in the direction of the prior trend (down). A break below $727 would project about $7 lower, toward $720.
- Possible Bullish Triple Bottom / Double Bottom: Repeated holds near $727-$728 (the lower band) with rising CMF could be a reversal base. It needs a close above $734, followed by SMA 200D reclaim, to confirm. The target would be roughly $741.
- Symmetrical Triangle / squeeze: The contracting Bollinger Bands and falling ADX suggest a compression ahead of a breakout. Direction is unconfirmed, and the tilt is slightly down given the prior trend.
POTENTIAL SCENARIOS
- Scenario 1: Bearish Range Breakdown — Price fails at the SMA 200D/EMA cluster, loses VWAP and the lower Bollinger Band, and the prior downtrend resumes. Trigger: close below $727.77 on rising volume with −DI expanding. Target: $720-$722. Invalidation: close above $733.60. (45% probability)
- Scenario 2: Neutral Continued Consolidation — Low ADX and the squeeze keep price oscillating between VWAP and the band edges. Trigger: no break of $727.77 or $733.61. Target: $728-$732. Invalidation: a decisive close outside the band on volume. (30% probability)
- Scenario 3: Bullish Reclaim of SMA 200D — CMF accumulation turns into a breakout above overhead resistance and the upper band. Trigger: close above $733.60 with volume above the recent average. Target: $738-$741. Invalidation: fall back below $730 VWAP and $727.77. (25% probability)
PRICE TARGETS
- Target Price: $727.80 (2-day horizon)
- Expected Range: $714.00 to $743.00 (about 2x the $14.52 typical move wide, shifted slightly lower for the bearish lean)
- Key Levels: Support at $727.77, Resistance at $732.55
OVERALL BIAS
OVERALL BIAS: BEARISH - Price is capped below SMA 200D and both EMAs, with −DI above +DI and a prior stair-step downtrend, so a break of the flat base is more likely to resolve lower. The positive CMF and low ADX limit conviction, so the expected move is modest.
This is educational analysis and not financial advice.