SPY 2-day bullish forecast — Nov 17, 2026
- Bias: Bullish
- Timeframe: 2 days (made Nov 17, 2026, target date Nov 18, 2026)
- Price at analysis: $732.40
- Price target: $735.50
- Expected range: $720.50 – $751.50
- Result: Pending — graded after the close on Nov 18, 2026
Get a free AI analysis of SPY today
Analysis
TECHNICAL INDICATORS
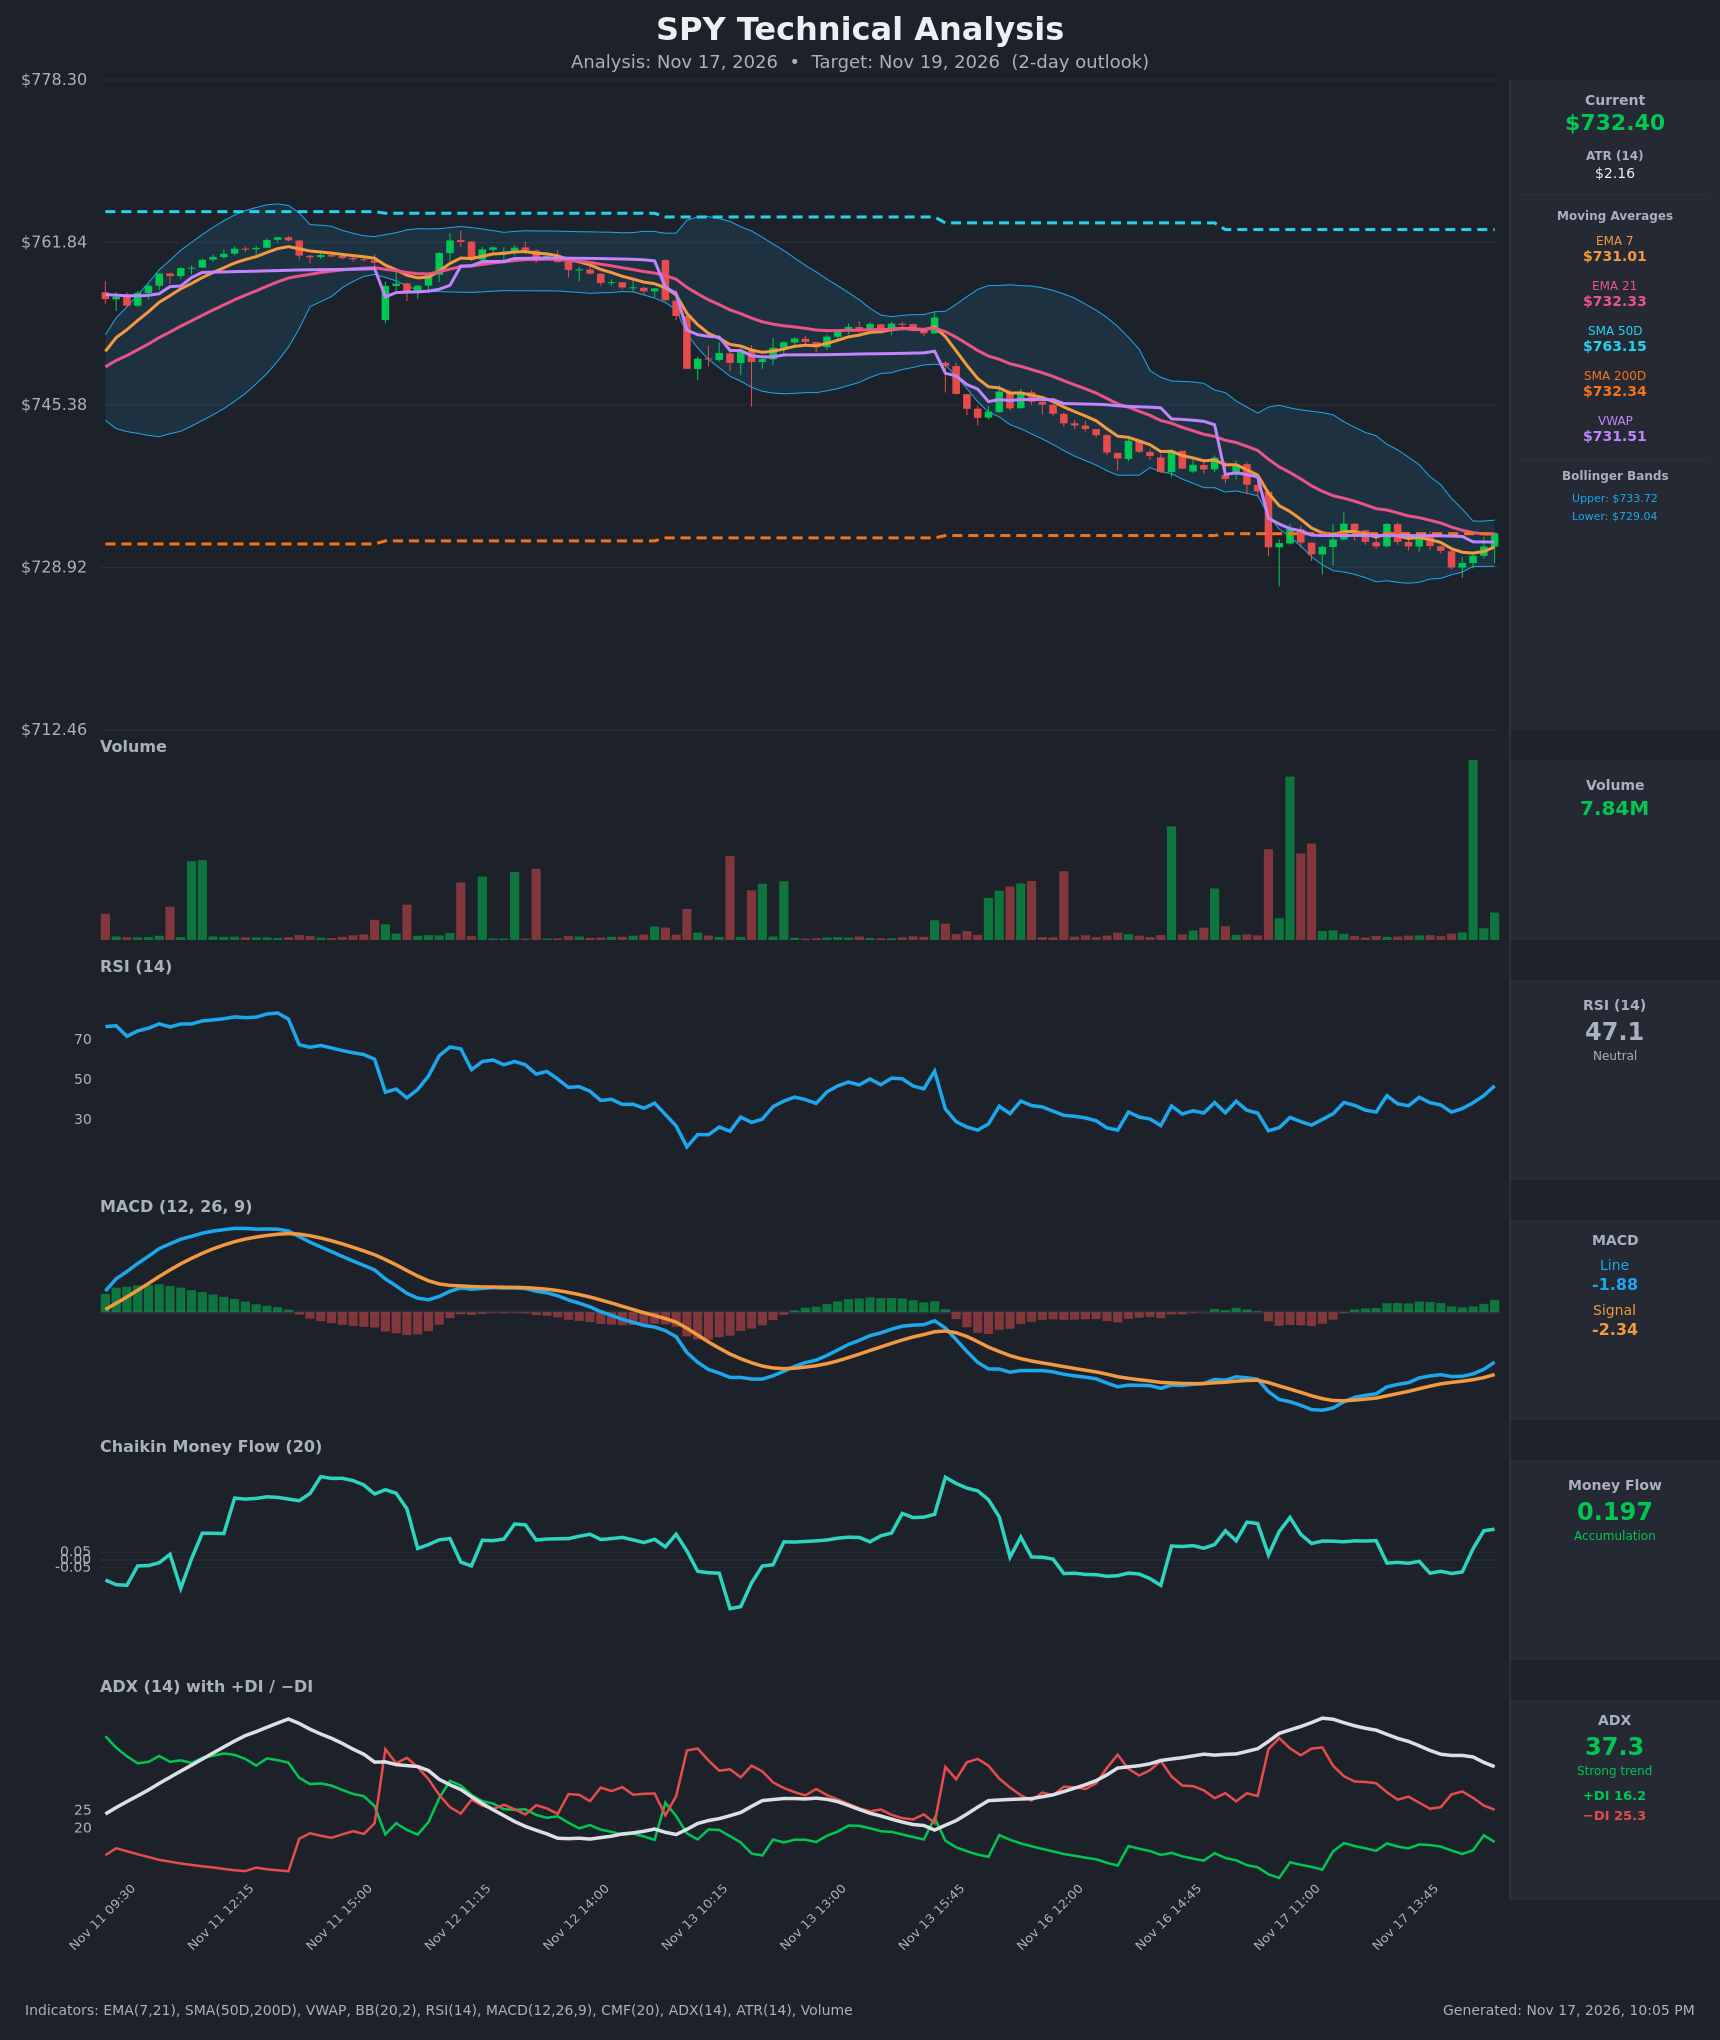
- RSI (14): 47.07, up sharply from the 34 low at 13:00 and 33.9 at 14:45. It has moved from near-oversold back to the neutral midpoint, so downside momentum has faded, though it has not yet crossed into bullish territory. [Bullish]
- Moving Averages: Price ($732.40) is above EMA 7 ($731.01), EMA 21 ($732.33), SMA 200D ($732.34) and VWAP ($731.51). All of these sit within about $1.40 of price, so they form a tight support cluster that price has just reclaimed. EMA 7 is still below EMA 21 (no bullish crossover yet), but the gap narrowed from -$3.4 to -$1.3. SMA 50D ($763.15) is about $31 overhead, still in a clear longer-term downtrend. Price at SMA 200D is a pivotal test. [Neutral]
- MACD: The line (-1.876) is above the signal (-2.342) after a bullish crossover around 13:15. The histogram is positive and expanding, but both lines are still below zero, so this is a rebound within a larger downtrend. [Bullish]
- Bollinger Bands (20): The bands are narrow, with the upper at $733.72 and the lower at $729.04. Price has bounced off the lower band ($728.93 low) back to just above the middle. Volatility has compressed, which favours an expansion move. [Bullish]
- CMF (20): +0.197, well above +0.05 and rising from -0.08 earlier. Buying pressure is building at the lows, which fits a bottoming attempt. [Accumulation]
- ADX (14): 37.3, a strong trend but falling from 49.6. −DI (25.3) is above +DI (16.2), so the trend is still bearish. The decline in ADX and the shrinking DI spread (from about 19 to 9) suggest the downtrend is losing steam. [Strong Trend - Bearish, weakening]
- Volume: 7.84M on the latest bar, the largest spike on the chart, and it is a green bar at the lows. That is a possible capitulation or absorption signature, though a single bar needs follow-through. [Bullish interpretation]
DIVERGENCES & TRENDS
- Possible bullish divergence: price made a new low at $728.93 around 14:45, but MACD (-2.419 → -1.876) and CMF (-0.087 → +0.197) have since turned up and RSI has recovered from 33.9 to 47. Price has recovered only modestly, so this is early and unconfirmed.
- Trend: the multi-day trend is down, with lower highs from the $761 area to about $733, a death-cross-style structure (SMA 50D far above SMA 200D) and −DI dominance.
- Crossovers: a bullish MACD crossover occurred around 13:15. Price reclaimed EMA 21, SMA 200D and VWAP on the last bar. There is no EMA 7/21 crossover yet.
- ADX: it is rolling over from an extreme reading, which often precedes a pause or reversal in the dominant trend.
CHART PATTERNS
- Bullish Falling Wedge (reversal): the decline since Nov 13 has formed lower highs and lower lows in a contracting channel, with the Bollinger Bands squeezing. The wedge is breaking up as price pushes above the upper trendline and the EMA 21. The measured target is a retrace toward the wedge origin, but the first realistic objectives are $735-$738.
- Possible Bullish Double/Triple Bottom: several tests of the $729 area have held, with the latest on high volume. A confirmed break above the $733.7-$736 neckline would support $738+.
- The SMA 50D at $763 is a distant cap, so any rebound is likely corrective unless price clears $738-$740.
POTENTIAL SCENARIOS
- Scenario 1: Bullish Wedge Breakout and Rebound — Price holds above the SMA 200D/EMA 21 cluster, MACD keeps rising and CMF stays positive, so the bounce extends. Trigger: a hold above $732.30 and a break of the $733.72 upper band. Target: $735.50-$738. Invalidation: a close back below $729.04. (50% probability)
- Scenario 2: Bearish Rejection and Trend Resumption — The bounce fails at the EMA 21/SMA 200D cluster, −DI stays dominant and sellers push price back to the lows. Trigger: a rejection at $733.7-$735 and a break below $731.00 (EMA 7/VWAP). Target: $726-$722. Invalidation: a sustained close above $736. (33% probability)
- Scenario 3: Neutral Range Chop — Price oscillates around the converged moving averages between $729 and $735 as the squeeze resolves slowly. Trigger: low-volume drift around $731-$734. Target: $731-$734. Invalidation: a break outside the $729-$735.90 range. (17% probability)
PRICE TARGETS
Typical 2-day move is about $15.58, so the range is about 2x that (about $31), shifted modestly upward to match the bullish lean.
- Target Price: $735.50 (2-day outlook)
- Expected Range: $720.50 to $751.50 (about 2x the typical move wide)
- Key Levels: Support at $729.04 (lower Bollinger Band and recent low), Resistance at $735.90 (prior intraday EMA 21 area; the first hurdle is the $733.72 upper band)
OVERALL BIAS
OVERALL BIAS: BULLISH - Price has reclaimed the EMA 21, SMA 200D and VWAP after a high-volume bounce off the lower Bollinger Band. MACD has crossed up, CMF shows accumulation, RSI is recovering and ADX is fading. The larger downtrend (−DI dominance, price far below SMA 50D) caps conviction, so the expected gain is modest.
This is educational analysis and not financial advice.