SPY 83-day bearish forecast — Nov 15, 2026
- Bias: Bearish
- Timeframe: 83 days (made Nov 15, 2026, target date Feb 5, 2027)
- Price at analysis: $754.37
- Price target: $732.00
- Expected range: $660.00 – $805.00
- Result: Pending — graded after the close on Feb 5, 2027
Get a free AI analysis of SPY today
Analysis
TECHNICAL INDICATORS
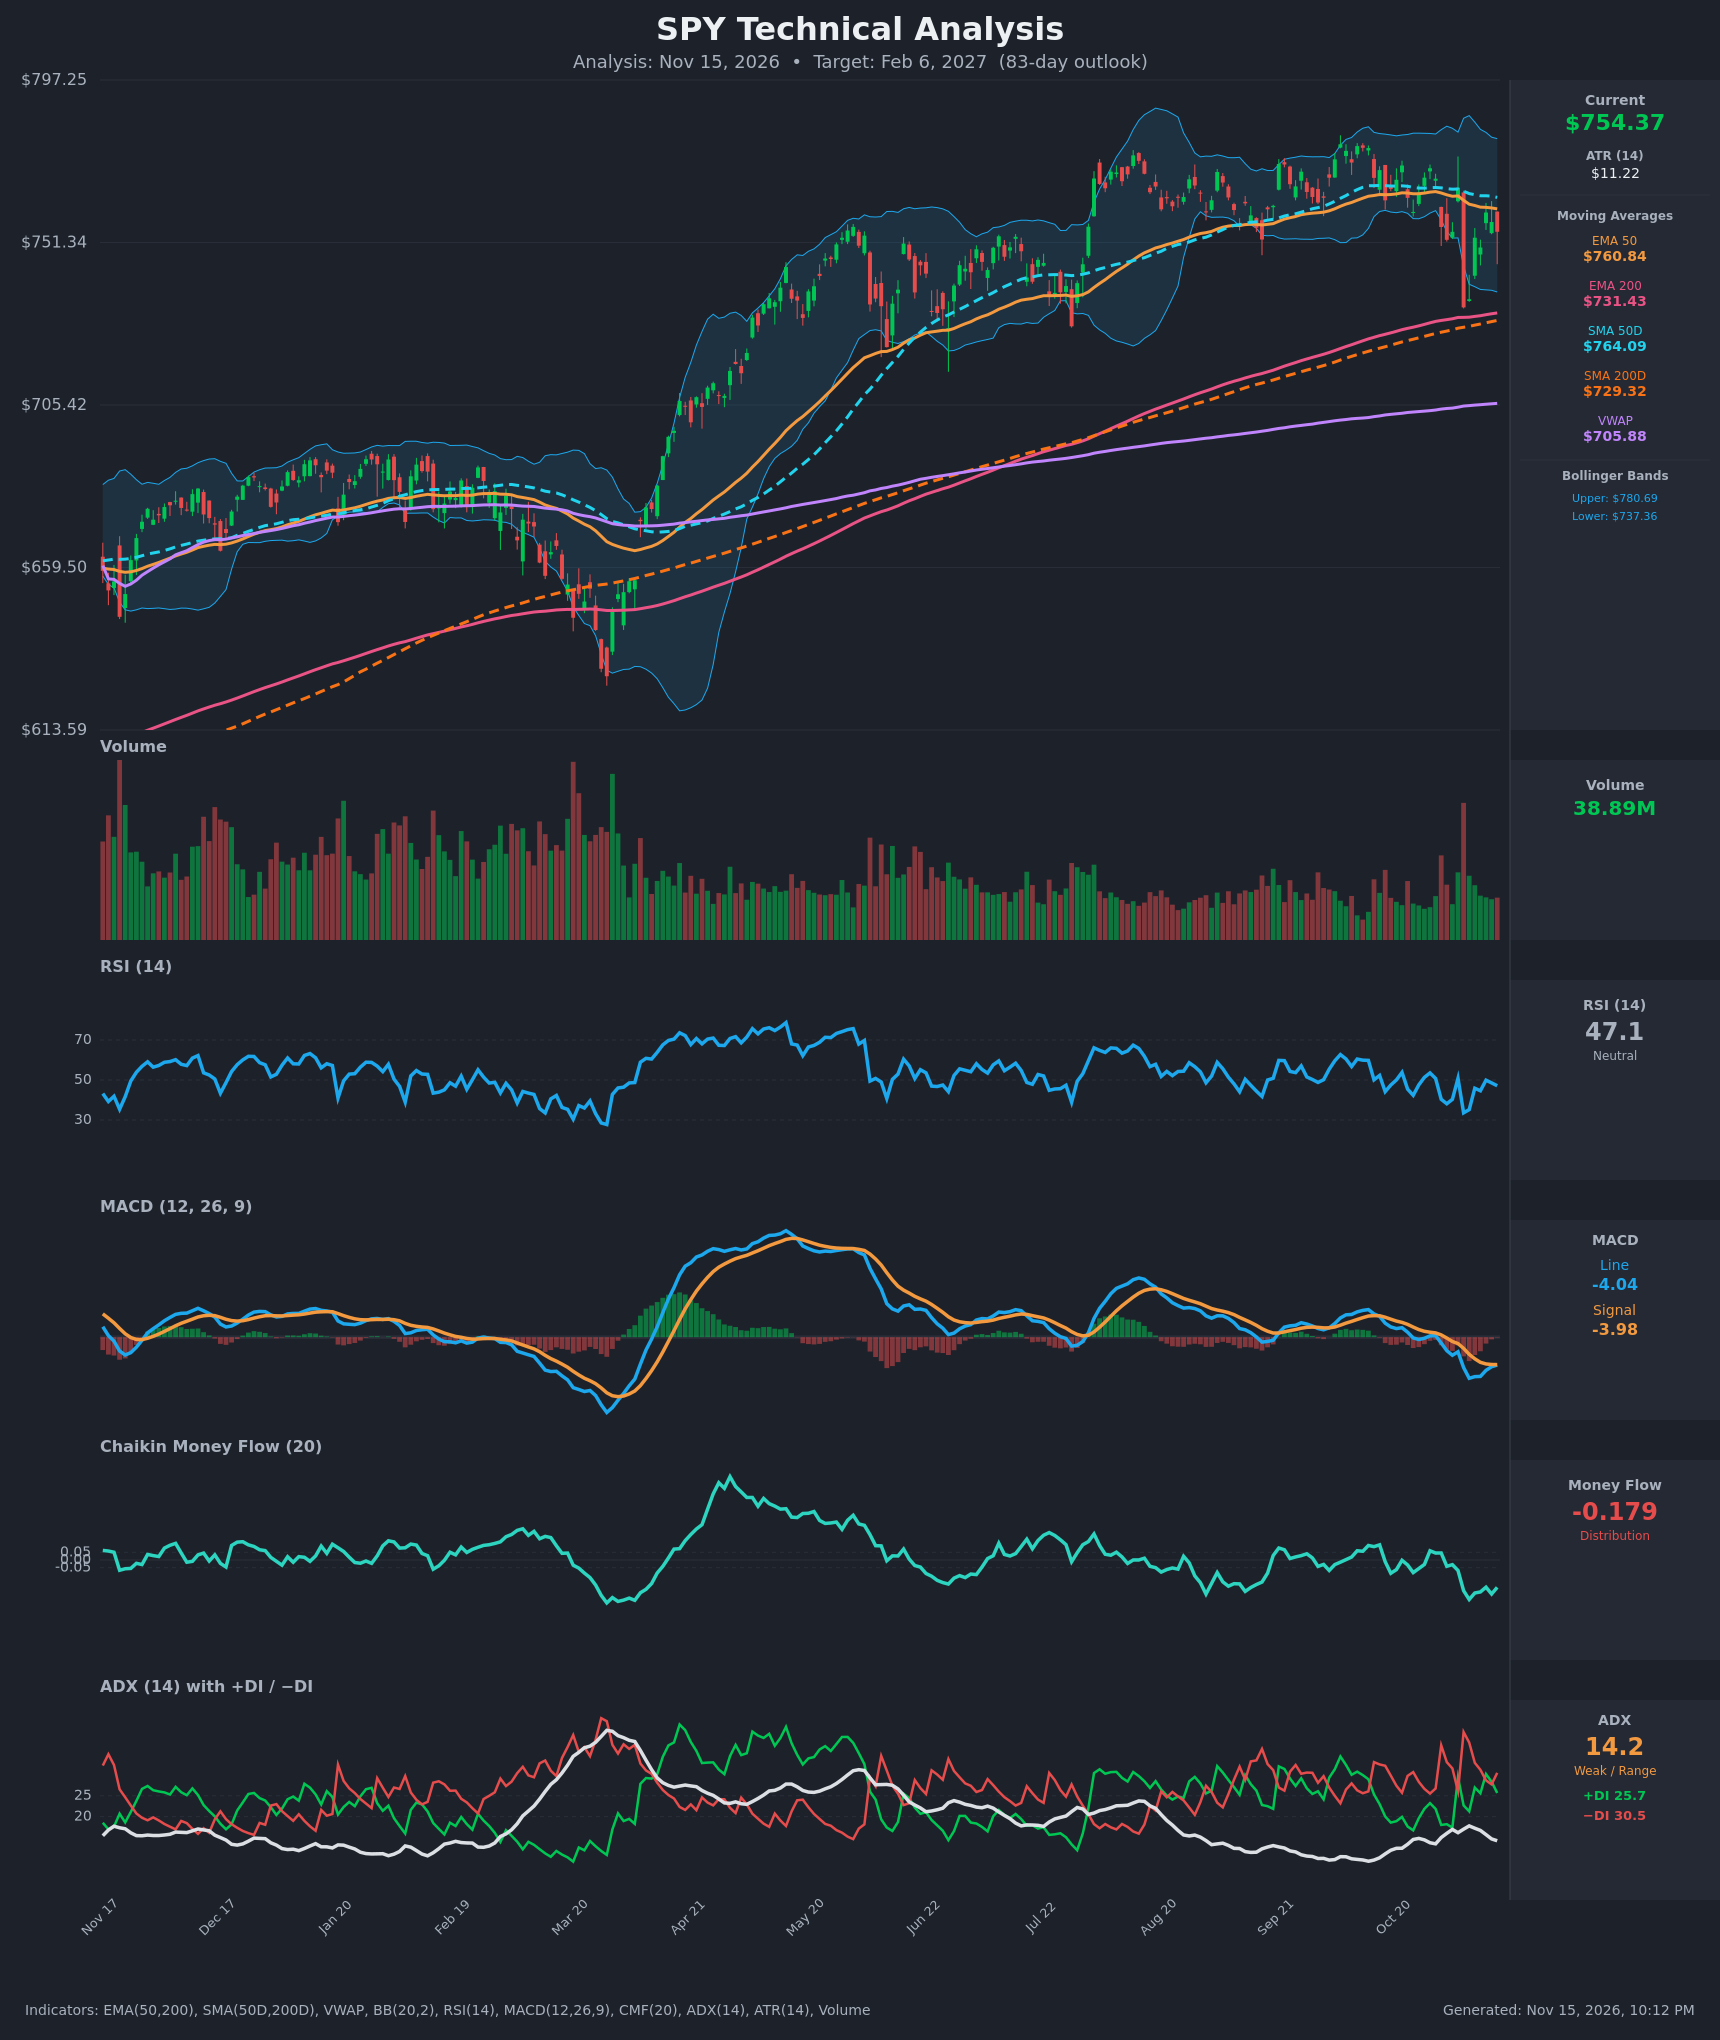
- RSI (14): 47.14, just under the 50 midline. It has swung between 33.6 (Nov 5) and 51 over the past two weeks and has not recovered above 50, so momentum is neutral to slightly soft. [Neutral]
- 20 EMA: The 20 EMA isn't supplied, so I'm using the 50 EMA at $760.84 and the 50 SMA at $764.09 as the nearby dynamic resistance. Price at $754.37 sits below both, and both are turning down, with the EMA50 sliding from $765 to $760.84. Price is still above the 200 EMA ($731.43) and 200 SMA ($729.32), which are rising. [Bearish]
- MACD: Line -4.04 vs signal -3.98, so the histogram is about -0.06. Both lines are below zero, and the line has been below the signal since Oct 30. The histogram has shrunk from about -3 to near zero, so downside momentum is fading and a bullish cross is possible. [Bearish]
- Bollinger Bands (20): Upper $780.69, lower $737.36, midline about $759. Price is in the lower half of the bands, below the midline, and well off the Nov 5 flush below the lower band. The bands are fairly tight, which fits consolidation. [Neutral]
- CMF (20): -0.179, well below -0.05 and the weakest reading since the March lows. It has been negative for several sessions, which shows persistent distribution. [Distribution]
- ADX (14): 14.2 with -DI (30.5) above +DI (25.7). The trend is weak or range-bound, but the weak directional lean is to the bears. +DI and -DI keep crossing, so there's no clean trend. [Weak Trend, bearish lean]
- Volume: 38.89M, in line with the muted average of recent months. The one large volume spike came on the Nov 5 sell-off (down about 4.4%), which marks that day as institutional selling. The rebound since has come on average volume. [Distribution on down days / unconvincing bounce]
DIVERGENCES & TRENDS
- Price has made a similar high around $770-775 twice (July–August and late October), while RSI and MACD peaked lower in the second push. This is a mild bearish divergence.
- MACD fell from a positive reading to -4.04 and is now flattening. The histogram is contracting, so selling momentum is fading, but a bullish signal-line cross hasn't happened yet.
- CMF is falling while price holds near $750-760. Money flow is weaker than price, which warns that the price stability is not well supported.
- The EMA50 and SMA50 are rolling over, and price has lost them. There is no death cross: the 50s are still above the 200s, and the gap is narrowing. The 200 SMA/EMA are rising and are the long-term support zone.
- +DI/-DI have crossed repeatedly with a weak ADX, a classic choppy environment. The current edge goes to the sellers.
CHART PATTERNS
- Bearish Double Top (reference diagram): Twin highs near $770-775 (late summer and late October) with a neckline near the Nov 5 low around $733. The pattern is not confirmed. A close below $733 would give a measured move of about $40 (peak to neckline), which targets roughly $690-695.
- Range / consolidation: Price has traded between about $733 and $775 for several months with ADX under 20. This is a sideways structure, so the neckline break is the key trigger.
- Counter-view: The long-term structure is still an uptrend (higher lows, price above rising 200s), and the Nov 5 flush was bought back. A close above $775-780 would invalidate the double top and could resume the uptrend toward $800+.
POTENTIAL SCENARIOS
- Scenario 1: Bearish Double-Top Breakdown — Distribution (CMF -0.179), -DI dominance and failure at the 50-day averages lead to a break of the $733 neckline and a test of the 200-day averages and lower. Trigger: daily close below $731-733 with rising volume. Target: $690-700, with the extreme near $665. Invalidation: daily close above $765-770. (45% probability)
- Scenario 2: Bullish Range Resolution Higher — The MACD bull cross and fading downside momentum let buyers defend the 200 MA zone and reclaim the 50-day averages, continuing the long-term uptrend. Trigger: close above $765 followed by $780. Target: $785-805. Invalidation: close below $731. (35% probability)
- Scenario 3: Neutral Range-Bound Chop — With ADX at 14, price keeps oscillating between $733 and $775 for the full period. Trigger: repeated failures at both $733 and $775. Target: $740-765. Invalidation: a close outside the $725-780 range. (20% probability)
PRICE TARGETS
- Target Price: $732.00 (83-day horizon, Feb 6, 2027)
- Expected Range: $660.00 to $805.00 (width $145 ≈ 19.2% of current price, in line with the 18-30% guidance for 61-180 days)
- Key Levels: Support at $733.00 (Nov 5 low, confluence with the EMA200 near $731), Resistance at $764.09 (SMA50, with EMA50 at $760.84 just below it)
OVERALL BIAS
OVERALL BIAS: BEARISH - Price has lost the 50-day EMA and SMA, CMF shows heavy distribution (-0.179), -DI is above +DI, MACD is negative, and a possible double top is forming with its neckline at about $733. Fading MACD momentum and the rising 200-day averages keep conviction modest and make the $731-733 area the make-or-break level.
This is educational analysis and not financial advice.